Engineering, monitoring and control for reliable decisions: from instrument selection to validated data in the hands of decision-makers.
Distribution and integration
Three readingsof the same dam.
We coordinate selection, installation, data and support, with responsibilities and scope agreed for each site.
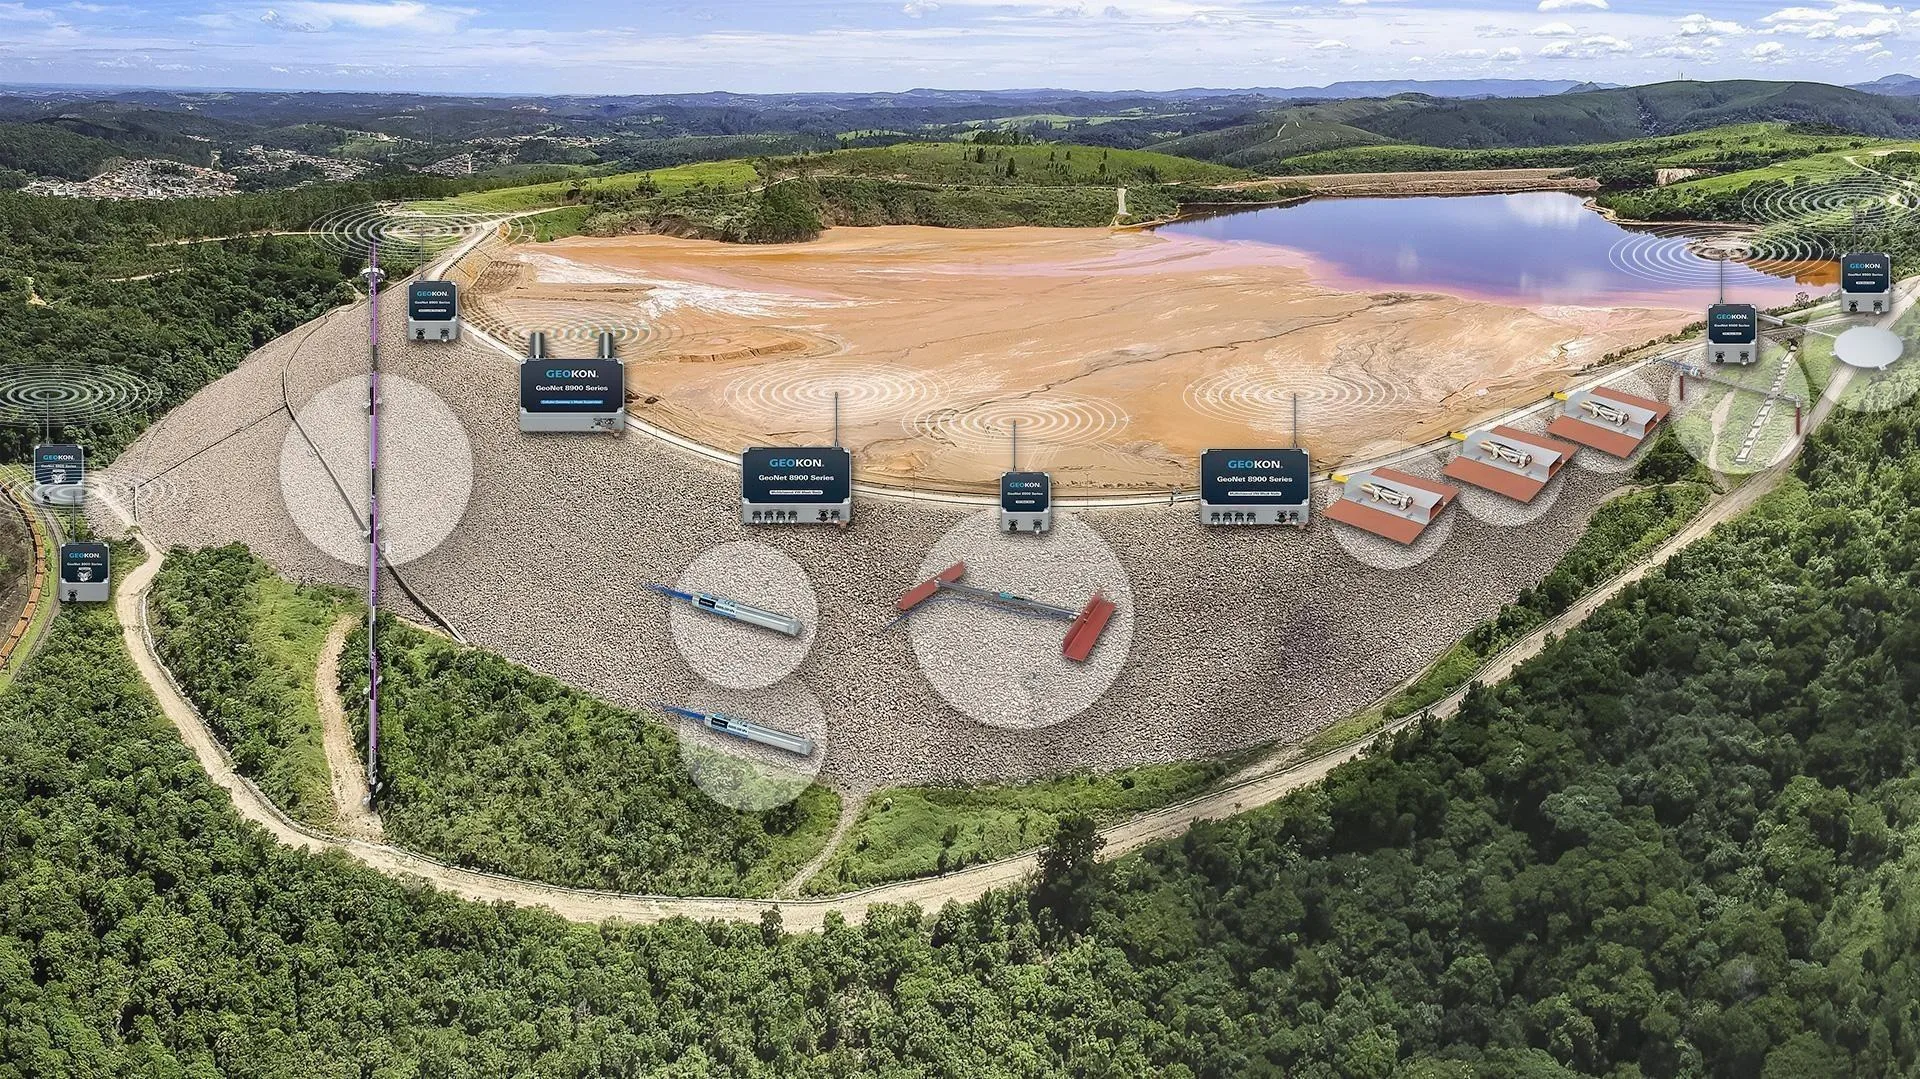
Instrumented dam · illustration
01
Inside the dam
Pore pressure, deformation and settlement: observing the variables the engineer of record needs to compare against the design.
02
Spatial behavior
Combining point measurements with spatial coverage to investigate anomalies and prioritize field checks.
03
Operating condition
Relating water, weather and dust to operations. Evaluating control measures through verifiable results.
Portfolio
Six dam problems,one portfolio that covers them.
Each mechanism requires a variable and a response. Thresholds, reading frequency and response are defined per site and by the dam's engineer of record.
The same scope across the whole portfolio, from specification to operation.
SelectionTogether with the engineer of record we define which variable to measure, where and with which instrument, according to the mechanism and the site.
SupplyEquipment from specialized manufacturers, configured and documented for each measurement point.
InstallationField installation and commissioning, with initial readings as a baseline.
Data integrationData loggers, communications and platform so validated data reaches decision-makers.
SupportTechnical support throughout the operation of the monitoring system.
01
Geotechnical instrumentation
Measure inside the dam
Sensors for pore pressure, deformation, settlement and total pressure, selected by mechanism and site, to interpret the response of the embankment and foundation.
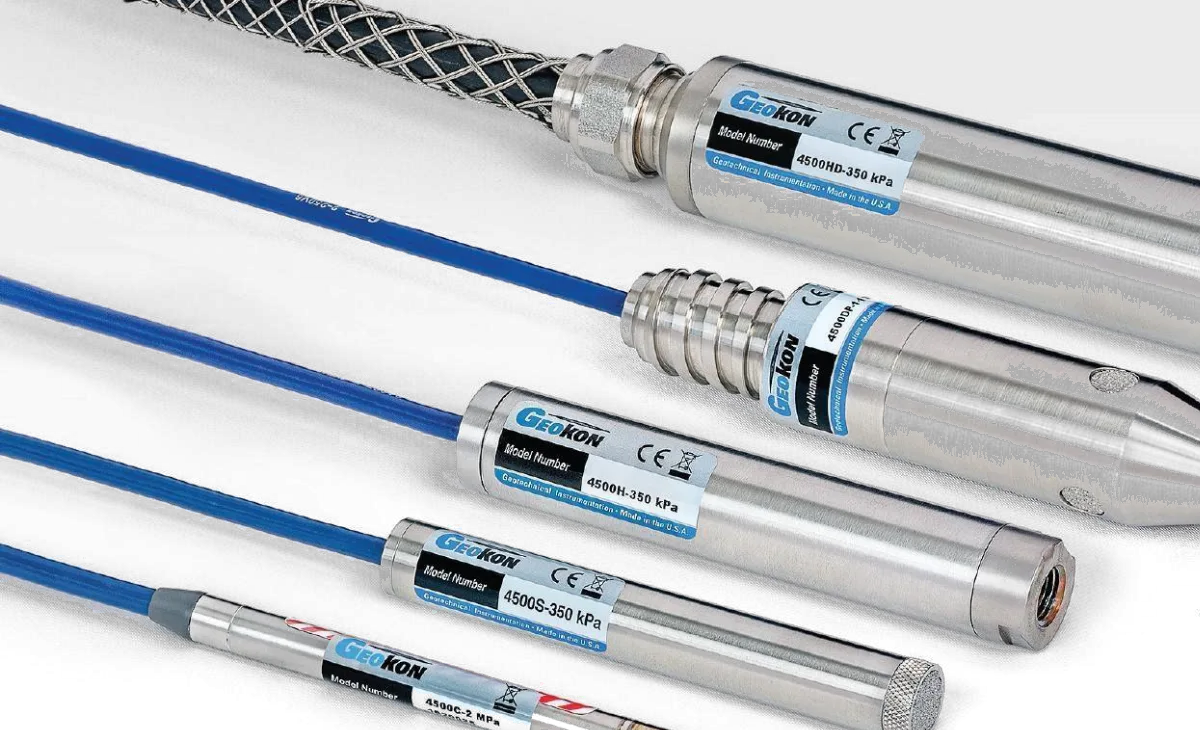
Vibrating wire piezometers
Pore pressure
Pore pressure to interpret the hydraulic condition of the embankment.
Vibrating wire piezometers
Principle
Measures pore water pressure in kPa or another calibrated unit. The sensor elevation allows hydraulic head to be calculated.
Installation
In embankments and foundations: track responses to deposition, drainage and changes in water level.
Engineering reading
Requires a saturated filter, appropriate seals, a baseline and the corrections specified by the manufacturer.
In boreholes
Define depth and measurement interval; saturate the filter and document seals, orientation and initial reading.
Fill and aggressive environments
Select materials compatible with the water chemistry. Protect cables and connections from traffic and dam raises.
Pore pressure feeds the effective stress analysis; on its own it does not determine stability. Agree on the installation record, coordinates, calibration and baseline to ensure traceability.
Weir monitor
Drain flow
Drain discharge from a stage–discharge relationship.
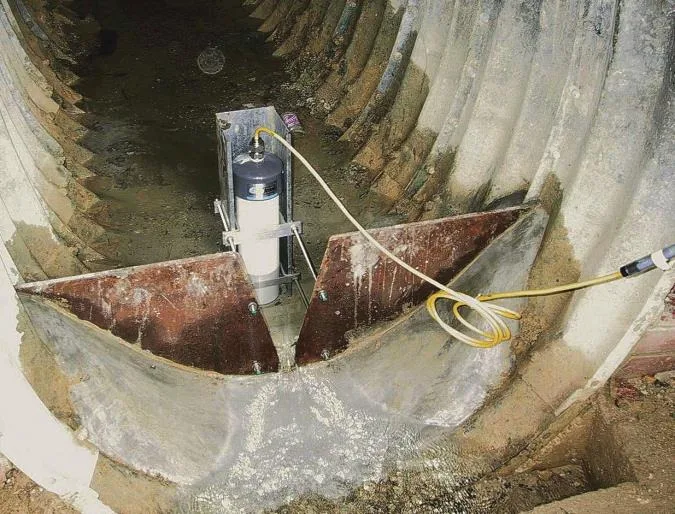
Weir monitor in the field
Float-based level measurement
Records the level at a weir. Flow is obtained from a stage–discharge relationship valid for its geometry.
Drain flow gauging
Monitor drains and outlets; keep the section clear and check for sediment, backwater and flow conditions.
Flow and turbidity guide checks in the context of rainfall, water level and operations.
02
Geotechnical instrumentation
Track internal deformation
Lateral displacement, settlement, strain between anchors and total stress in the fill, to locate shear zones and compare against the design.
MEMS inclinometry
Profile at depth
Displacement profiles to locate shear zones.
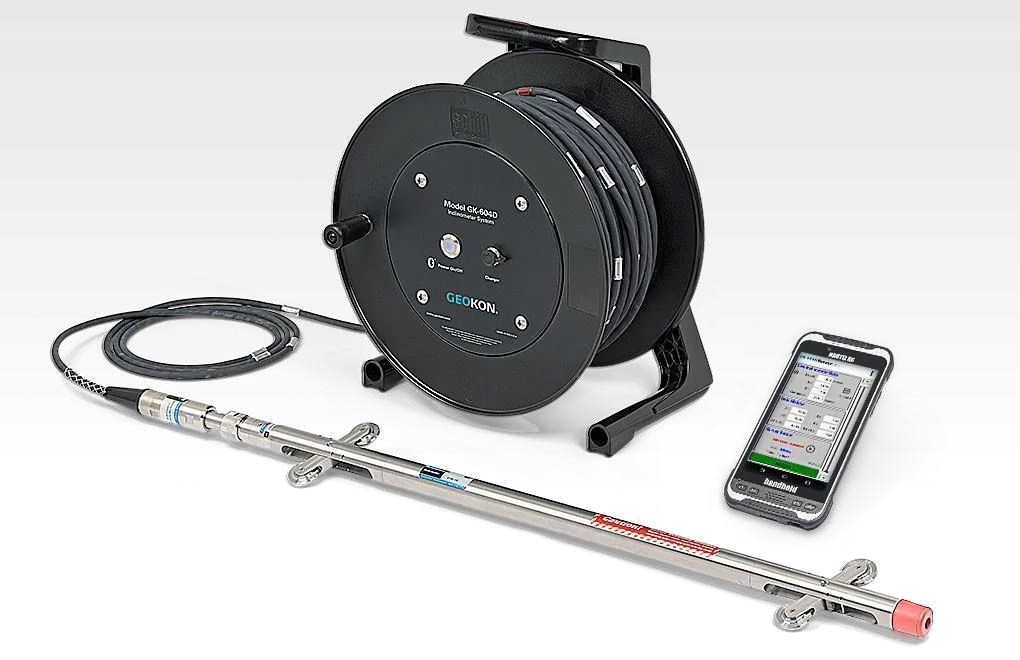
Portable inclinometer probe
Portable probe
The probe measures inclination in a guide casing. Repeated readings against the baseline allow lateral displacement to be calculated.
Permanent systems
Track inclination at instrumented positions; they require compatible mounting and acquisition.
Locate changes in the displacement profile at depth, complementing GNSS and surface observation.
Hydraulic settlement system
Relative elevation
Fill settlement relative to a stable reference.
Hydraulic principle
Records changes in relative elevation through pressure; tracks settlement at instrumented points.
Installation
Compare the behavior of the embankment and foundation against loading, raises and consolidation.
Result
Requires a stable reference, protected tubing, air control and temperature and density corrections.
Interpret settlement together with pore pressure and loads; do not confuse it with lateral displacement.
Extensometry and joint opening
Strain between anchors and movement of discontinuities.
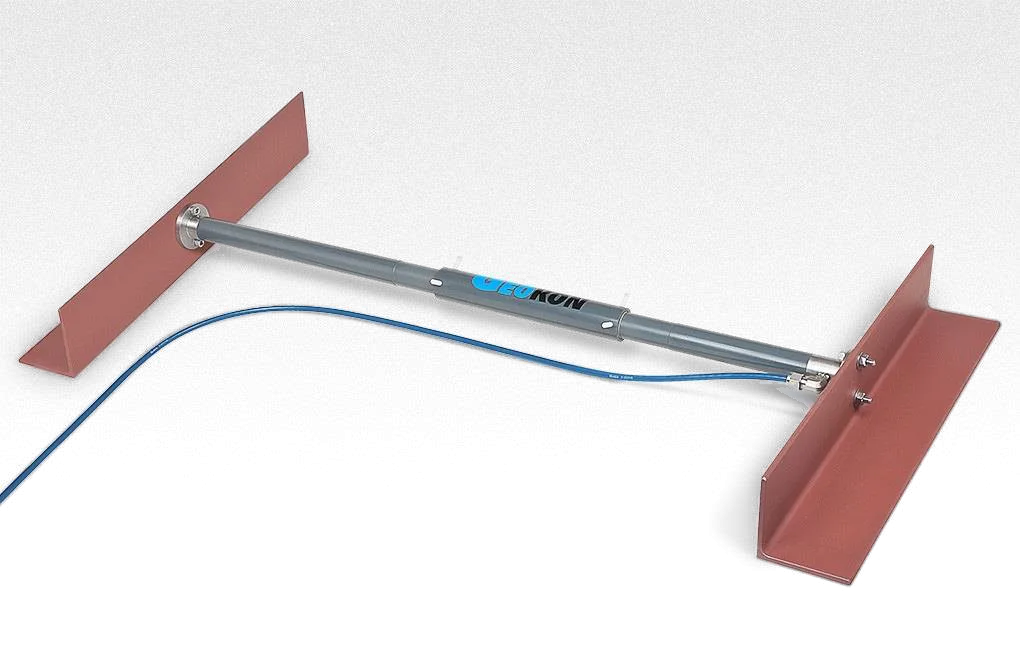
Soil extensometer
Soil extensometer
Measures the change in length between anchors: tracks localized strain in the installed direction.
Crack meter
Records the opening or closing of a crack or joint; depends on anchoring and orientation.
Complement local measurement with inspection, dated photographs and displacement of the surroundings.
Total pressure cells
Total stress
Total stress in the fill and at contacts.
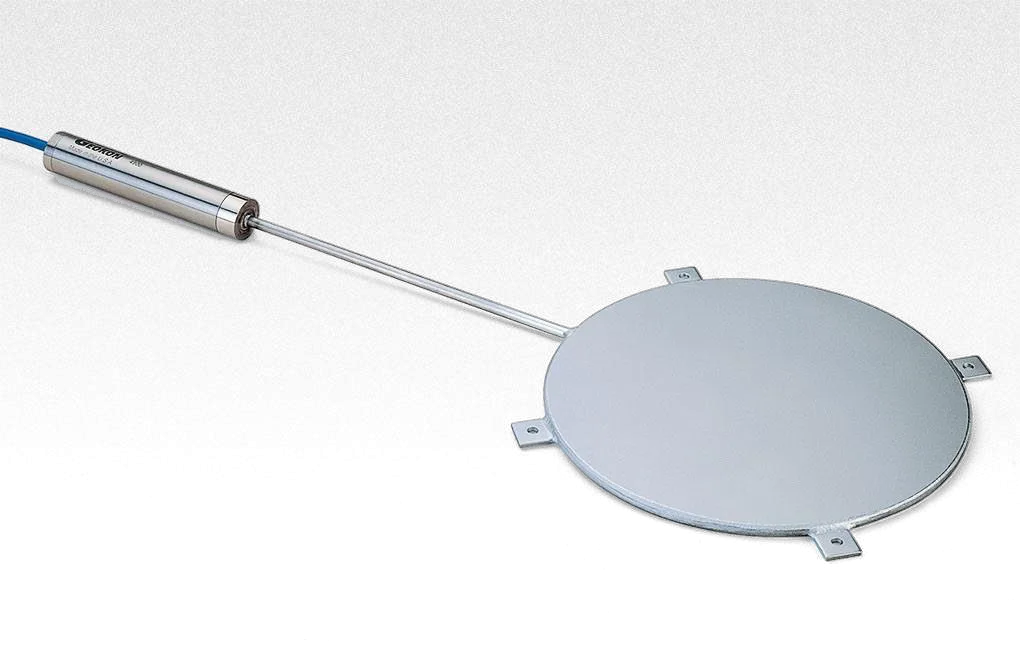
Principle
The cell measures total pressure normal to its plane, not pore pressure or effective stress directly.
Installation
Observe load transfer in fills, contacts or foundations according to the instrumentation design.
Interpretation
Uniform contact is essential. Consider temperature, stiffness and installation disturbance.
Total pressure cell
Combine total and pore pressure only with measurements compatible in location, time and saturation.
03
Geodesy · Radar · Satellite
Watch the crest, benches and slope move
Point measurements and area coverage: GNSS, ground-based radar, surveying and satellite InSAR, each with its own precision, latency and reach.
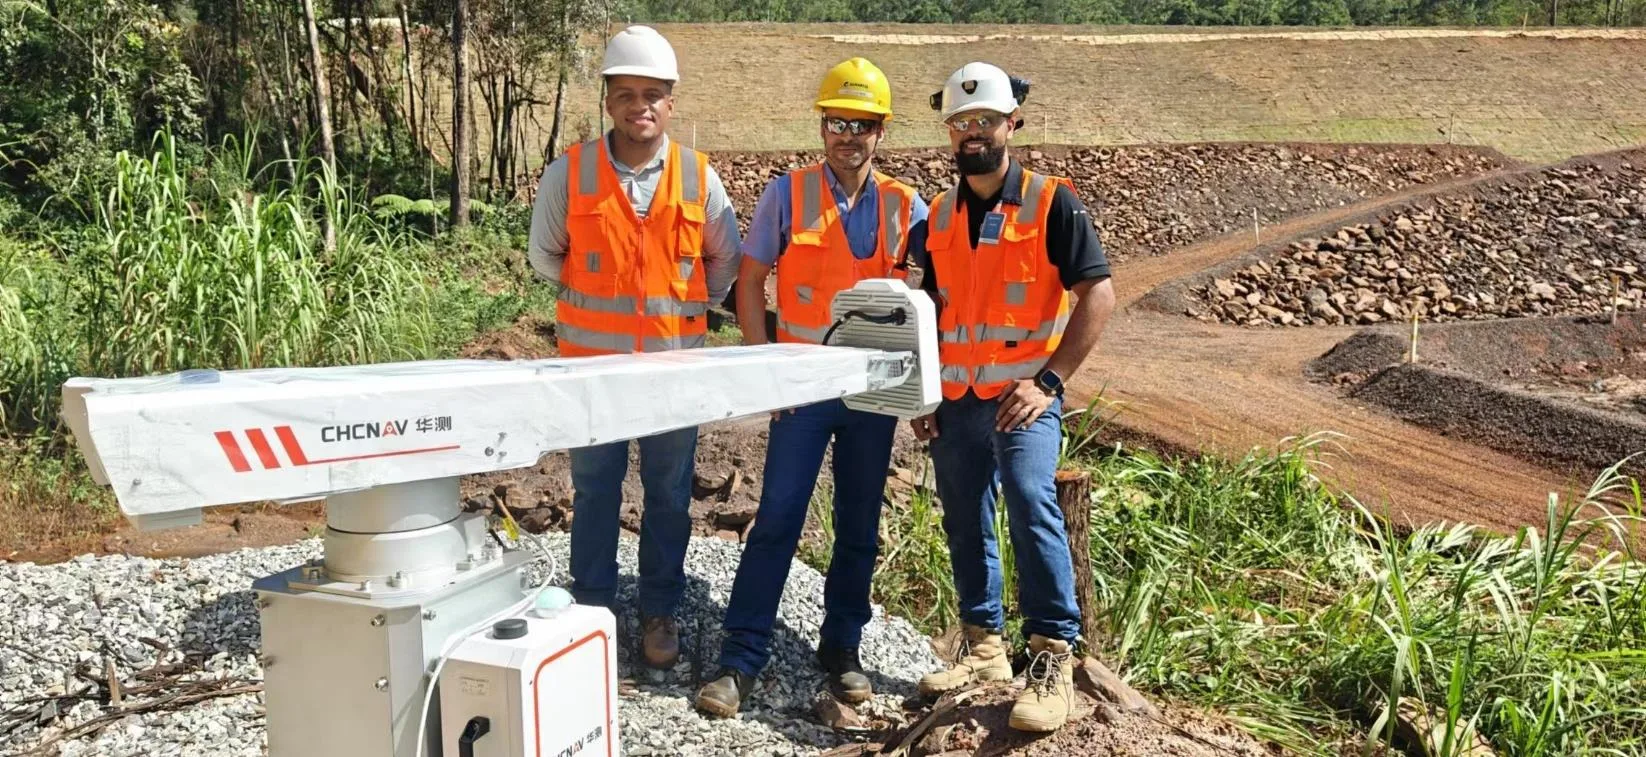
Ground-based radar in the field
GNSS + MEMS
Point displacement
Movement and changes in behavior at the crest and benches.
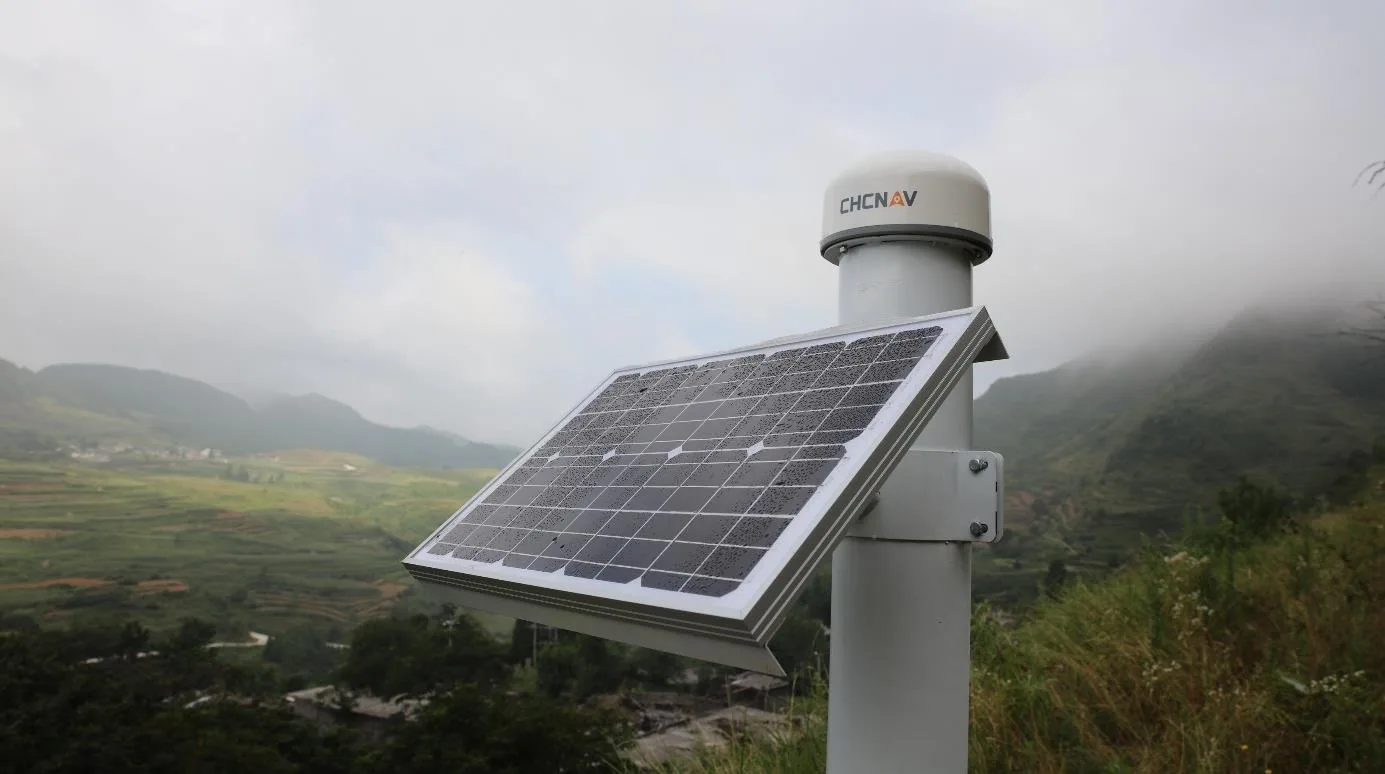
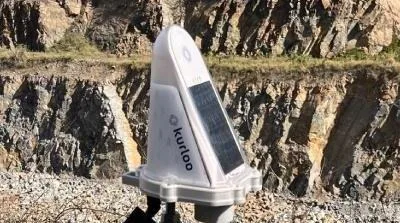
GNSS receiver with solar kit
Measurement
Combines GNSS and MEMS sensors. Processing delivers displacement relative to a reference, not stability.
Application
Track points on the crest and benches and compare them with radar, inclinometry and inspections.
Installation
Requires a stable mount, clear sky view, a reference, power and a link; validate latency and quality.
< 1.8 WReceiver power consumption
1,408GNSS channels
IP67Equipment protection
Mode
Use
Condition
Post-processing
Trend analysis
Interval and quality depend on observation and processing
RTK
Lower latency
Requires corrections, a link and a valid GNSS solution
Automatic
Configured rules
Validate mode changes; this does not mean predicting a failure
Choose processing according to expected velocity, required precision and response capacity. Stable reference, clear sky view, backup power and reception testing.
GB-SAR ground-based radar
Displacement maps
Displacement maps for large areas of the slope.
0.1 mmLine of sight
Up to 5 kmNominal range
120 s360° sweep
IP65Rated protection
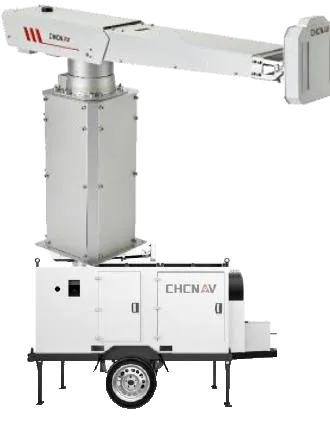
Trailer-mounted ground-based radar
Principle
Measures line-of-sight displacement on visible surfaces with adequate return.
Variables
Track spatial trends and prioritize reviews; on its own it does not deliver a 3D vector.
Coverage design
Geometry, atmosphere, stability and shadows determine useful coverage. Complement with GNSS.
Power and data
Size the battery, backup and supply; configure the link and transmission and check availability and latency.
Nominal range does not guarantee coverage of the whole dam. Define visible sectors, references and return quality before configuring zones, thresholds and response.
Radar with camera
Measurement + visual context
Radar and imagery: measurement and context to review an anomaly.
Compact radar with camera
Radar
Observe the displacement component measured in the sector.
Image
Review visible conditions in the observed sector alongside the trend.
Site
Validate geometry, power and communications before configuring.
Proposed review workflow, not automatic.
MeasureCheck reference, signal and temporal consistency. Data quality.
ReviewCompare the trend, the image and nearby instruments. Operating context.
ActApply the approved procedure and thresholds. Engineer of record.
The image supports visual review; it does not confirm sub-millimeter displacements or replace the technical protocol.
Surveying: total stations and GNSS
Independent reference
Surveying provides an independent geometric reference.
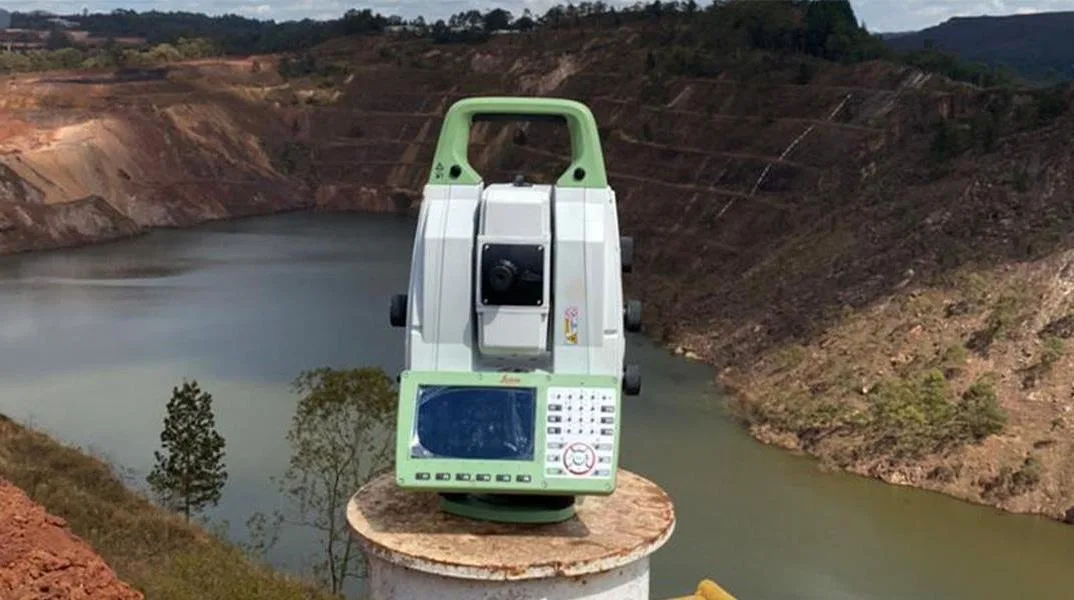
Total station on a monitoring pillar
Principle
Total stations and GNSS observe coordinates; comparable campaigns allow displacement of monumented points to be calculated.
Network design
Establish control outside the zone of influence; verify visibility, geometry and stability of references.
Quality
Select precision, frequency and automation according to the objective. Different instruments are not equivalent configurations.
Compare trends with a documented datum, uncertainty and quality control.
Relative GNSS network
Crest and benches
A relative GNSS network for crest and bench deformation.
Measurement node
Observes GNSS position and auxiliary variables depending on configuration. Displacement is calculated relative to a reference.
Link and processing
A gateway connects the nodes to processing. Verify coverage, power, data access and mounting.
GNSS network node
Track points on the crest or benches and compare trends with inspection and other technologies.
GNSS with defined cadence
Trends by point
Track displacement with a defined reference and cadence.
Autonomous GNSS unit on a slope
Measurement
The GNSS solution tracks position changes through appropriate processing and reference.
Deployment
Observe trends at points with a clear sky view and stable mounting; complement with spatial coverage.
Interpretation
Agree on frequency, latency, precision, power and platform access; do not assume real time.
Choose the cadence according to the decision required and complement it to capture fast events.
Satellite InSAR
Regional and historical context
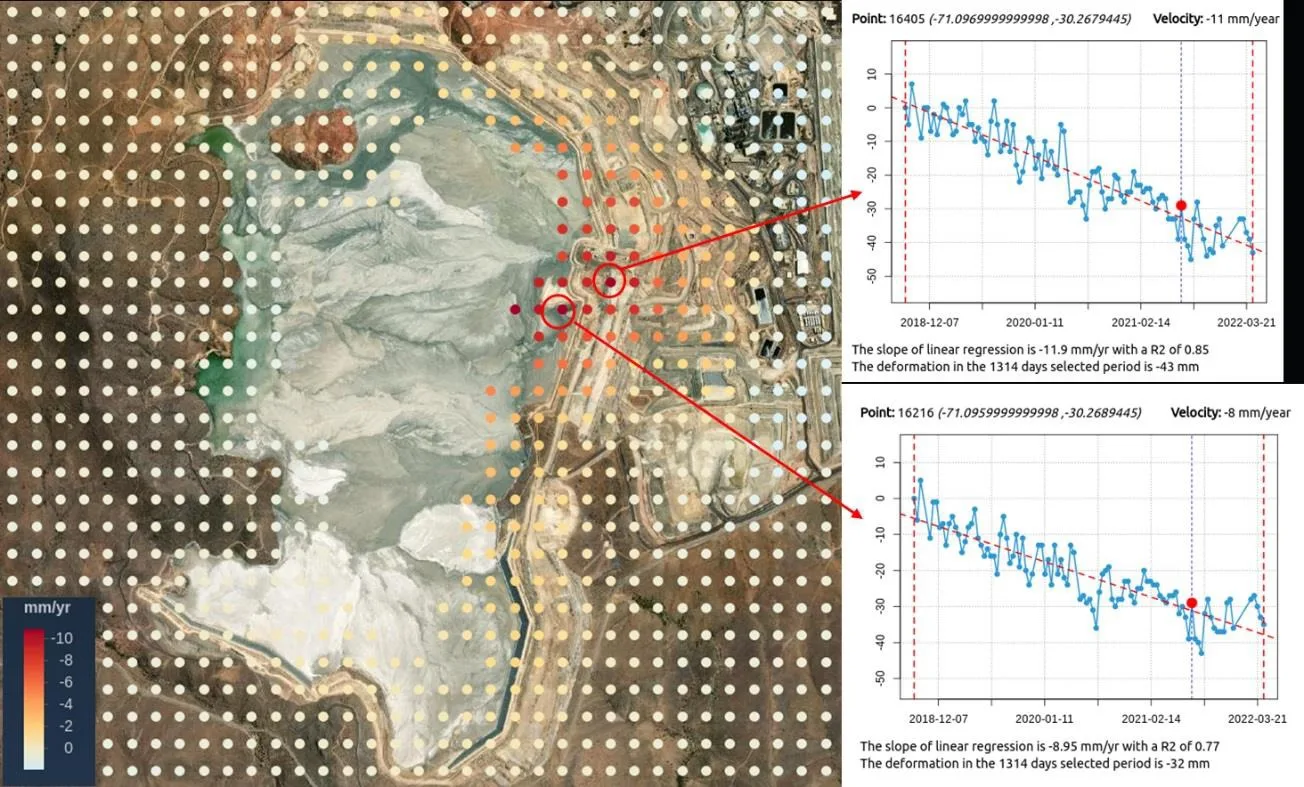
Satellite deformation with spatial and historical context.
Velocity map and time series
Principle
Estimates line-of-sight displacement from satellite radar images with sufficient coherence.
Processing
Provides regional coverage and available history to prioritize reviews of the dam and its surroundings.
Analysis platform
Organizes time series and indicators to review spatial and temporal evolution and document anomalies.
Check orbit, coverage, coherence and dates. It is not equivalent to continuous monitoring or 3D displacement.
04
Geophysics · Fiber optics
Find seepage before it advances
Preferential subsurface flow paths, foundation discontinuities and thermal anomalies in the embankment, to direct the investigation.
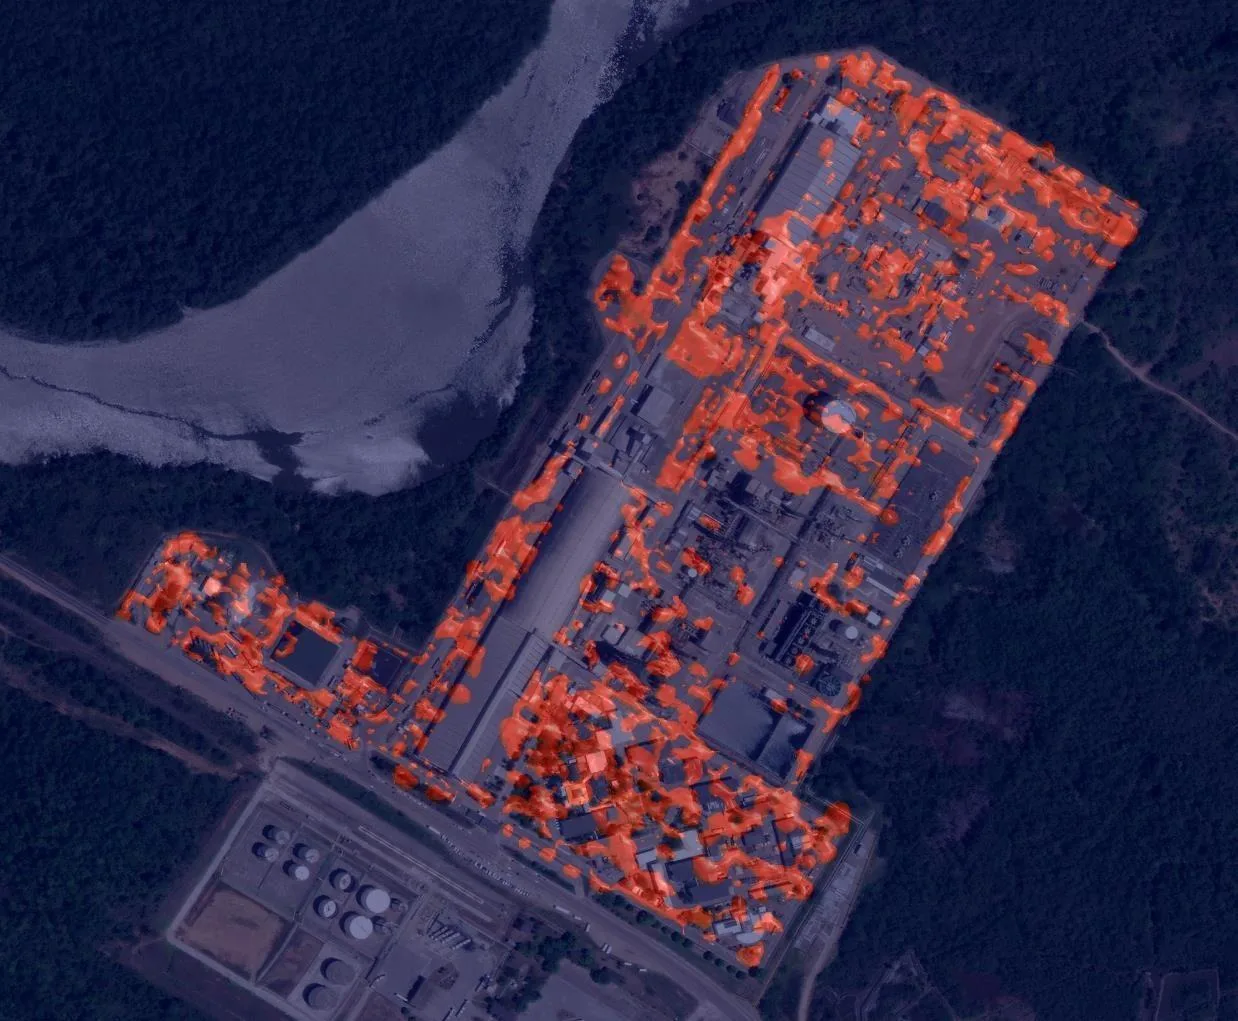
Groundwater flow mapping
Controlled current
Investigate preferential seepage paths with geophysical support.
3D model of conductive anomalies
Controlled source
Uses a controlled current and measures its magnetic field to investigate conductive paths.
2D / 3D model
Identifies conductive anomalies and forms connection hypotheses that must be verified in the field.
Use by the consultant
Prioritize discharges, hydraulic tests or new instrumentation points where a technical hypothesis exists.
Compare with geology, water chemistry, drains and piezometry; it does not measure flow directly. Repeat under comparable conditions to evaluate changes after an intervention.
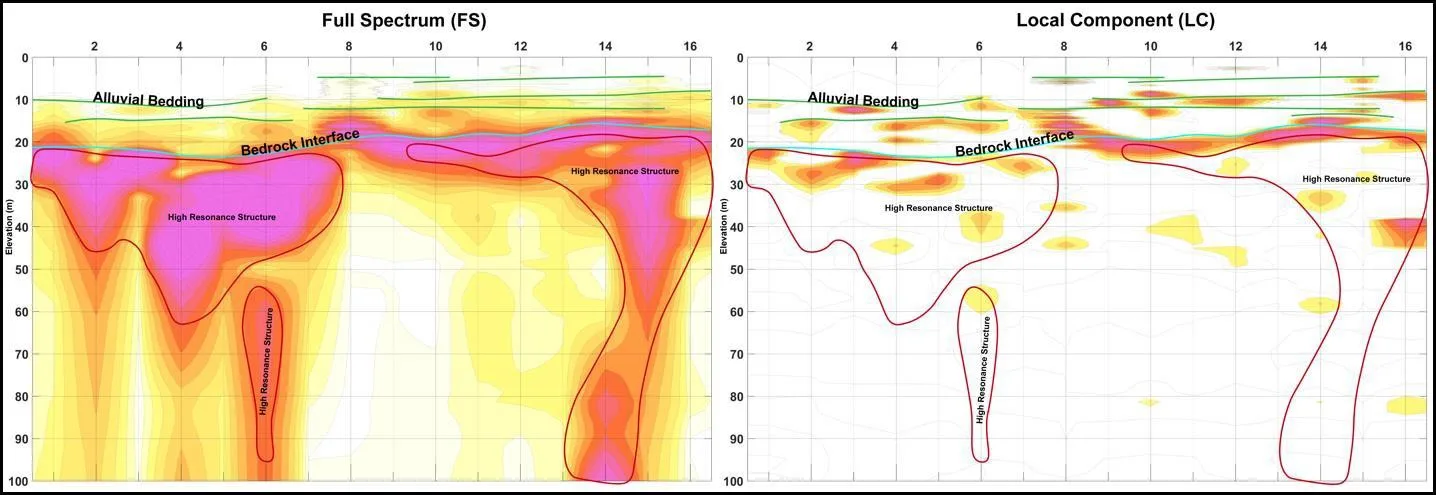
Microseismic resonance · MSR
Passive method
Passive characterization of subsurface and foundation discontinuities.
Bedrock and karst features
Ambient vibration acquisition
Interprets seismic signals to investigate subsurface contrasts; it does not replace a geotechnical campaign.
Interpretation
Supports the selection of areas to verify contacts, fractures, porosity or possible voids, depending on site conditions. It helps locate optimal zones for water wells.
Deliverable
Relate anomalies to topography, geology and background information; prioritize profiles or verification boreholes.
Sections of anomalies at depth
Turn anomalies into a verification program with boreholes, tests and geology, not into automatic conclusions about the foundation.
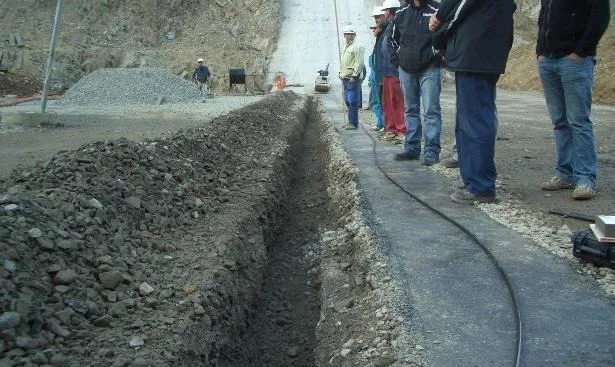
DTS fiber optics in the embankment
Distributed temperature
The fiber detects thermal anomalies to investigate seepage.
Fiber installation in a trench
Optical principle
Measures temperature along a fiber. Persistent anomalies can guide the investigation of water circulation.
Thermal contrast
Active thermal excitation requires suitable cable and power; it is not a feature of every fiber.
Design at the dam
Design the route, coupling, protection and baseline. Interpret together with weather, water level and operations.
Provides spatial continuity between point sensors; anomalies are validated hydraulically.
05
Fiber optics · Vibration · Acquisition
From sensor to decision
Pipeline leaks, vibration from construction, blasting and earthquakes, and the acquisition, communication and alarm chain that delivers validated data to decision-makers.
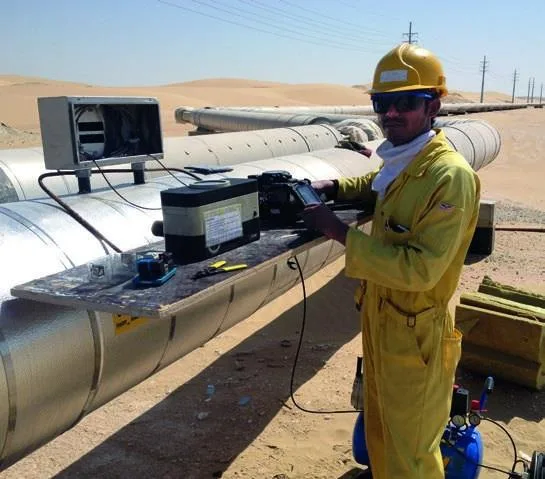
DTS + DAS fiber optics on pipelines
Tailings and water lines
Locating leaks and events on tailings and water lines.
Fiber optics on a pipeline
DTS · thermal signature
Tracks temperature along the fiber.
DAS · dynamic signature
Records dynamic disturbances along the fiber. They are different variables.
Application
On pipelines and areas of interest, compare signals with operations, flow and pressure to investigate events.
Locating events requires design, coupling, a baseline and validated rules for each application.
Linear heat detection
Thermal protection
Thermal protection of pumping and power infrastructure.
Measurement
Detects temperature increases in cables or areas of critical infrastructure.
Location
Tunnels, conveyors and auxiliary equipment when the fire protection design justifies it.
Response
Requires routing, zones and thresholds; integration with panels must be designed and tested.
Complements operational protection; it does not replace dam stability monitoring.
Seismographs and vibration monitoring
Triaxial seismograph
Measuring vibration helps evaluate the dam's response.
24-bitAcquisition resolution
50–2,000Samples per second
IP65Aluminum enclosure, 1.5 kg
Construction and blasting
Triaxial velocity: peaks and frequency to characterize vibration induced by the works.
Earthquakes
Acceleration: record the event and compare the response between points on the dam.
Joint interpretation
Correlate with piezometry, displacement and post-event inspection.
Event and background
Pre-event of 1 to 30 s and post-event of 1 to 100 s; peak recording by interval.
Network and notifications
GPS/NTP synchronization; Ethernet, Wi-Fi or 4G; email and SMS notifications with remote access.
Sensor according to the objective
Velocity with a triaxial geophone; acceleration with MEMS or force-balance sensors.
Thresholds specific to the dam and an approved response; do not automatically apply limits used for buildings.
Acquisition and communications
Data loggers · wireless networks
A defined data path from instrument to platform.
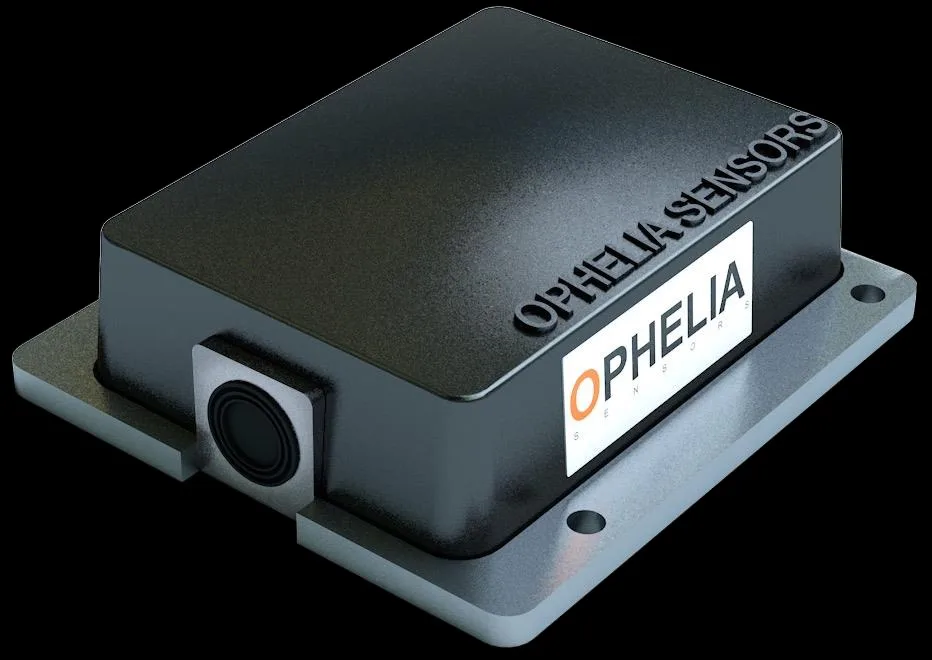
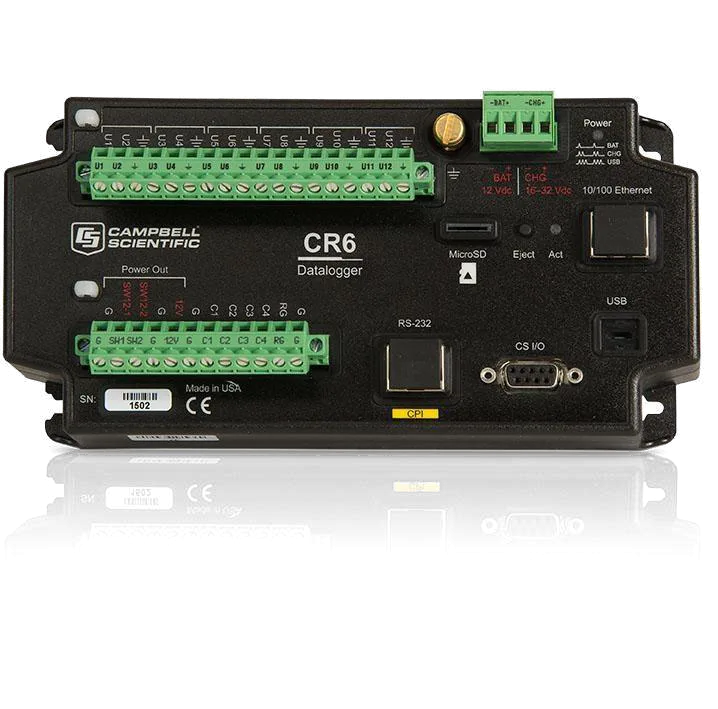
Programmable data logger
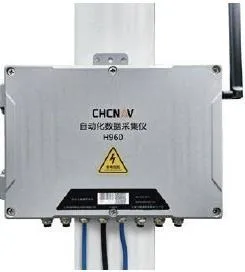
Wireless data loggers
Acquire compatible vibrating wire, temperature or specific signal sensors. LoRa/LoRaWAN requires a suitable gateway and coverage.
Programmable data loggers
Acquire compatible signals and read vibrating wire sensors with spectral analysis; the program converts signals into calibrated variables.
Logic in the field
Define storage, communications, backup and health alarms; test the complete chain.
Size coverage, frequency, power and storage before automating readings. Preserve the data, unit, calibration and sensor status from acquisition to visualization.
Multi-source platform and alarms
Visualization · notifications
Integrate complementary sources with verified compatibility.
Radar
Displacement in sectors with adequate geometry and return.
GNSS
Point displacement; MEMS tilt and acceleration are different variables.
Multi-sensor data logger
Up to 16 channels depending on configuration, for compatible sensors; validate signal, range and power.
Multi-sensor data logger · 16 channels
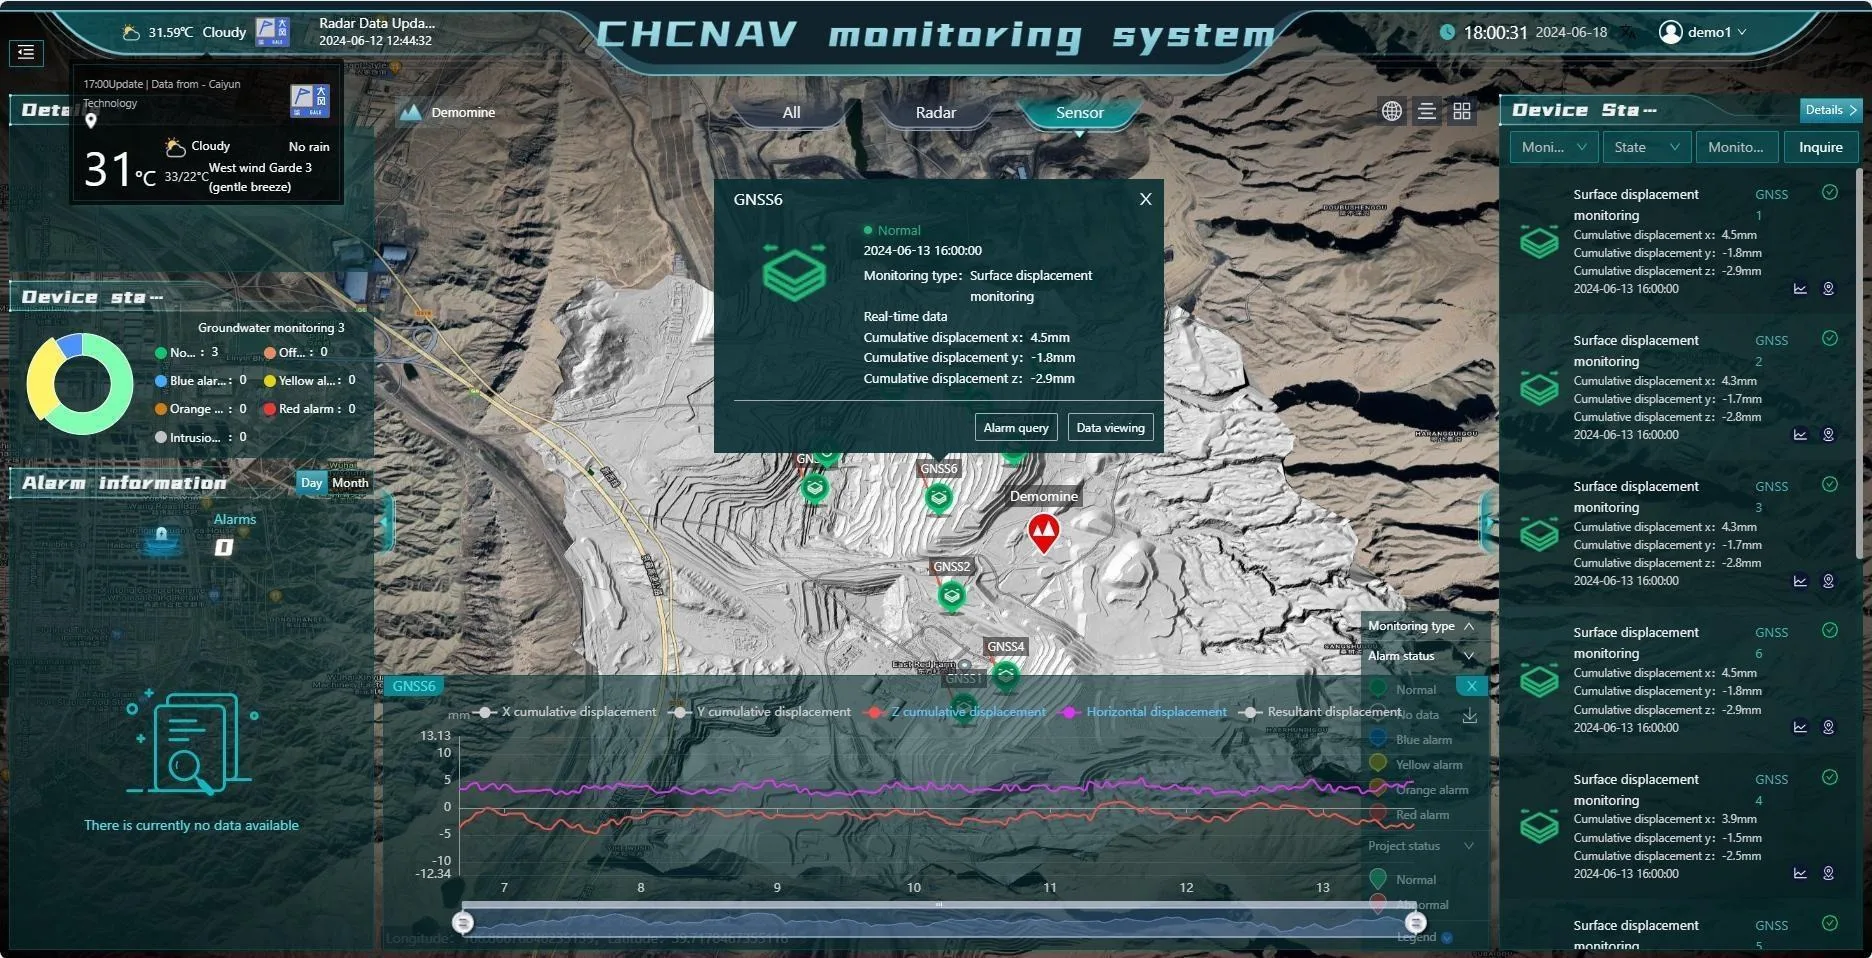
Visualization and alarm platform
Acquisition
Check availability, timing, units and quality before interpreting a trend or triggering a rule.
Analysis
Cross-reference time series with operating context; document hypotheses and field verification.
Notifications
Assign responsibilities, escalation and closure, without delaying urgent actions set out in the response plan.
Integration requires common time, metadata and quality; correlation does not prove causation. Link depends on the site: local network, cellular, radio or satellite.
Data management and response
Trigger action response plan (TARP)
A useful alarm requires validated data and a defined action.
ValidateThe engineer of record defines thresholds and trends by mechanism, quality, baseline and operating condition.
InterpretAssign responsibilities and timeframes. Validate the signal without delaying urgent actions set out in the plan.
RespondRecord decisions and closure; test communications and update criteria when the dam changes.
The response plan links observation and action; an instrument alarm is not, on its own, a confirmed emergency.
06
Hydrology · Weather · Environment
Control water, weather and dust
Flow gauging and pond geometry, weather loading, particulates at the perimeter, dust suppression and evaporation of excess water, with verifiable results.
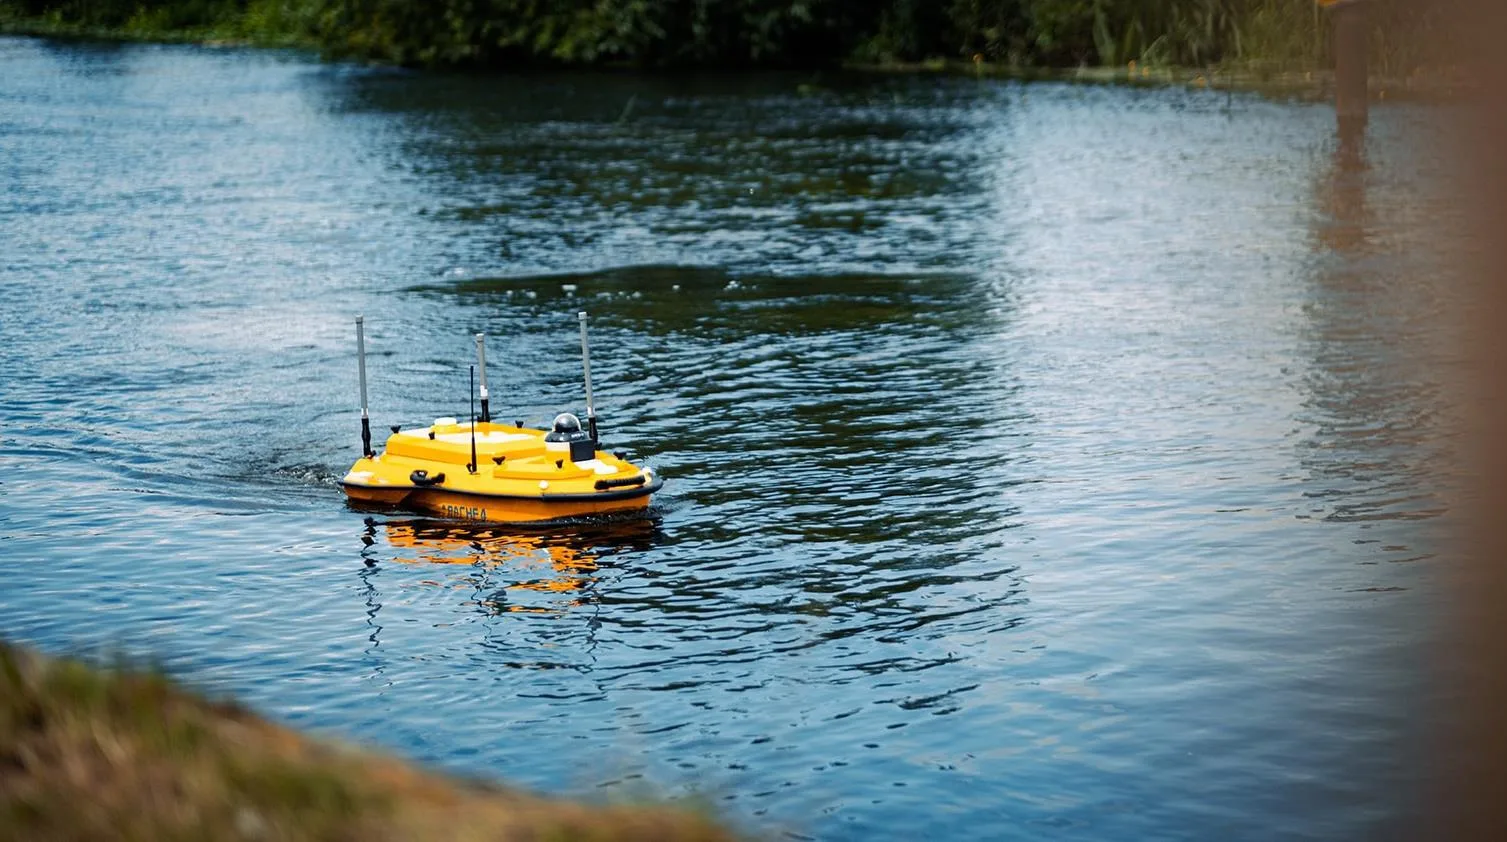
Bathymetry with an uncrewed surface vessel
ADCP flow gauging
Section discharge
Velocity per cell and section discharge.
Doppler principle
Obtains velocity profiles; with valid geometry and transects, discharge is estimated at a section.
Discharge calculation
Gauging where navigation, depth and hydraulic conditions allow.
Application
Requires positioning, quality control and corrections for moving bed or unmeasured zones.
Provides gauging data for the water balance; the discharge of a section is not equivalent to total storage.
Bathymetry with an uncrewed surface vessel
Submerged geometry
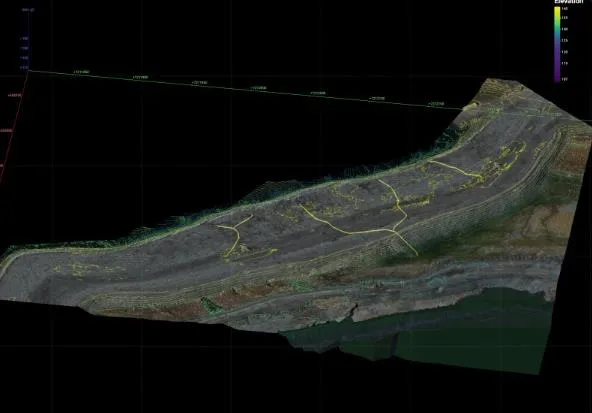
Submerged geometry for pond capacity and evolution.
Measurement
The echo sounder measures depth to an acoustic interface; positioning allows the bottom to be modeled.
Survey
Comparable campaigns help estimate geometry and storage, with a controlled datum and water level.
Deliverable
Verify sound velocity, draft and coverage. Soft tailings can produce ambiguous interfaces.
Combine bathymetry with surveying of dry areas; no single method covers the full geometry.
Weather
Environmental loading
The environmental loading that explains water, dust and evaporation.
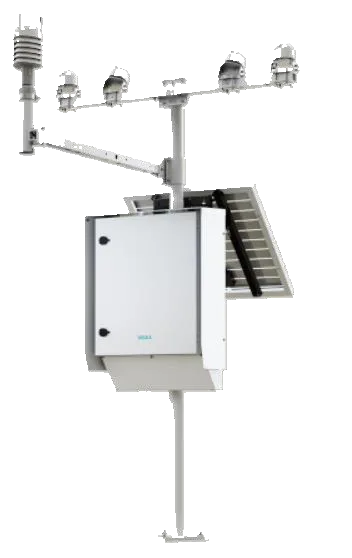
Weather station
Precipitation and water balance
Precipitation and selected variables to interpret water inflows and operating conditions.
Wind and evaporative potential
Wind, temperature and humidity support dust and evaporation analysis. Radiation requires specific sensors.
Define exposure, location and maintenance before relating weather to the dam's responses.
Particulate and air quality monitoring
PM10 · PM2.5 · gases
Particulates measured at the dam perimeter.
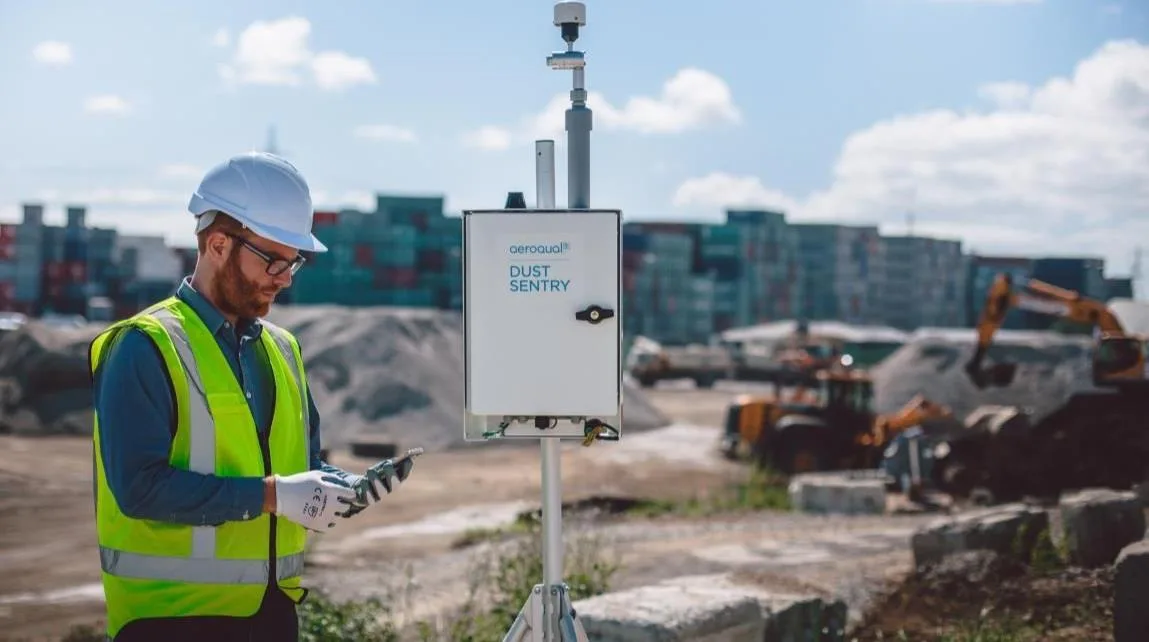
Perimeter particulate monitor
Optical measurement
Estimates particulate concentration, such as PM10/PM2.5, in μg/m³; it does not measure total emissions.
Observation network
Locate representative points and record wind, activity and maintenance to evaluate trends.
Optical response depends on aerosol and humidity. Measure before and after an intervention under comparable conditions.
Modular air quality stations
Particulates and gases
Environmental evidence to verify control actions.
Configurable station
They incorporate modules depending on configuration. Choose particulates or gases that match the project objective.
Remote traceability
Relate time series to weather and activity, without automatically attributing the source to the dam.
Evaluation
The cloud platform centralizes data according to license and link; agree on alarms, backup, maintenance and calibration.
Modular air quality station
Compare points and periods with quality control to prioritize actions and verify performance.
Dust suppression
Trial and scale-up
Binding of fines to reduce surface emissions.
Suppressant applicationTreated surface
MechanismThe surface suppressant reduces the release of fines; its selection depends on the tailings and the application water.
Trial designCompare treated and untreated areas: particle size, moisture, water, dose and application.
IndicatorsEvaluate dust, surface strength and durability with recorded wind and operations.
Economic criteriaReview runoff, infiltration and environmental compatibility before extending the application.
Agree on acceptance and cost per area and duration, not just price per liter. Dust control does not, on its own, improve geotechnical stability.
Evaporators for water disposal
Enhanced evaporation
Transfer of water to the air under defined operating conditions.
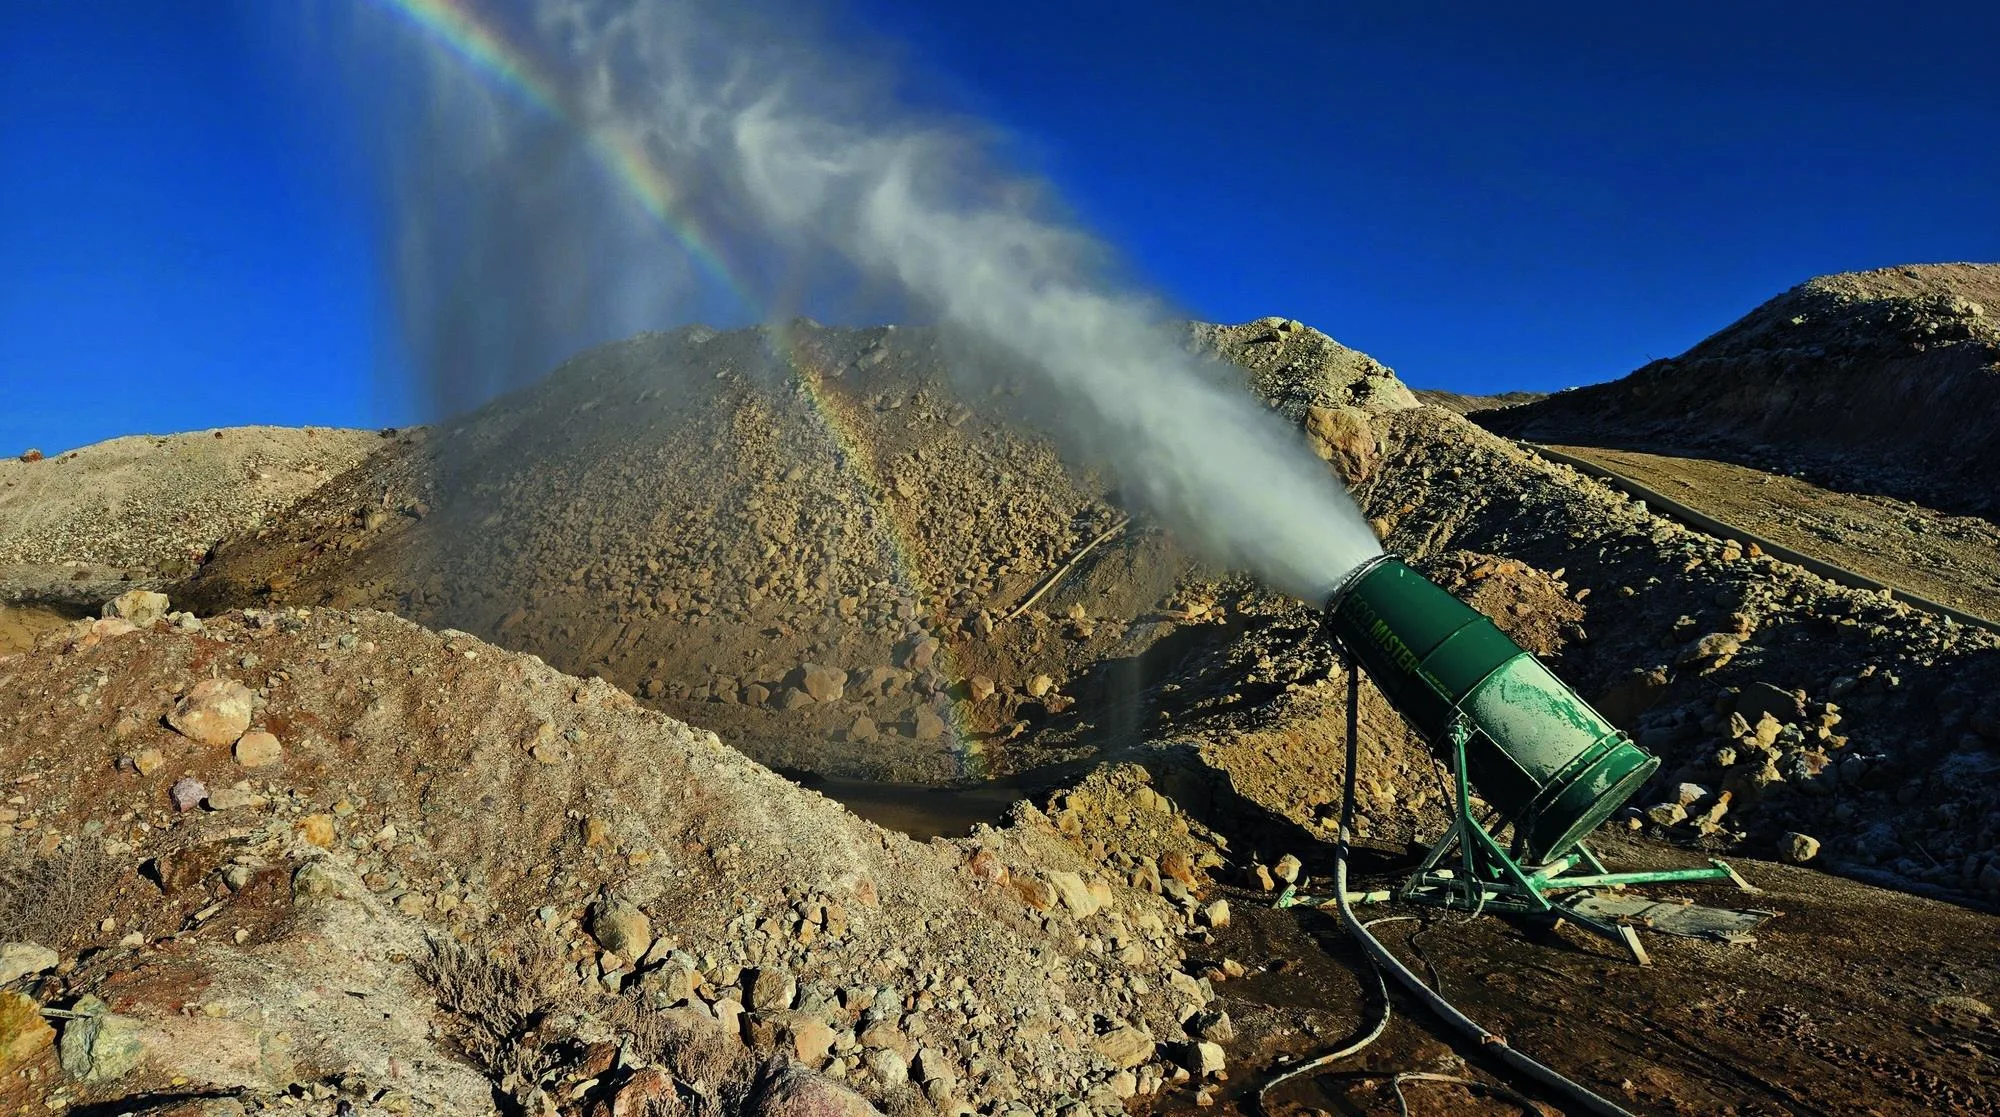
Evaporator over a tailings dam
Physical principle
Atomizes water to promote evaporation in suitable weather; part of the flow may return or drift.
Capacity calculation
Measure supplied water, returns and losses; estimate attributable evaporation with a representative campaign.
Operational control
Include weather, water quality, power, maintenance and drift control in the evaluation.
Feed flow is not net evaporation. Evaporation does not remove contaminants. Compare cost per m³ of water actually removed.
Frequently asked questions
What we are asked most often.
What is monitored at a tailings dam?
Pore pressure with piezometers, embankment deformation with inclinometers, prisms, GNSS and InSAR, seepage, pond level and volume with bathymetry, and weather.
Does monitoring help comply with NOM-141 and GISTM?
Yes. Continuous monitoring generates the data record, thresholds and alerts that both standards require to demonstrate control of dam stability.
How is seepage detected at a tailings dam?
With electromagnetic groundwater flow mapping, which reconstructs the conductive water paths to direct verification and remediation.
What happens when a sensor exceeds a threshold?
The platform sends a green, amber or red alert to the person responsible for the dam, with the sensor history to decide the action.