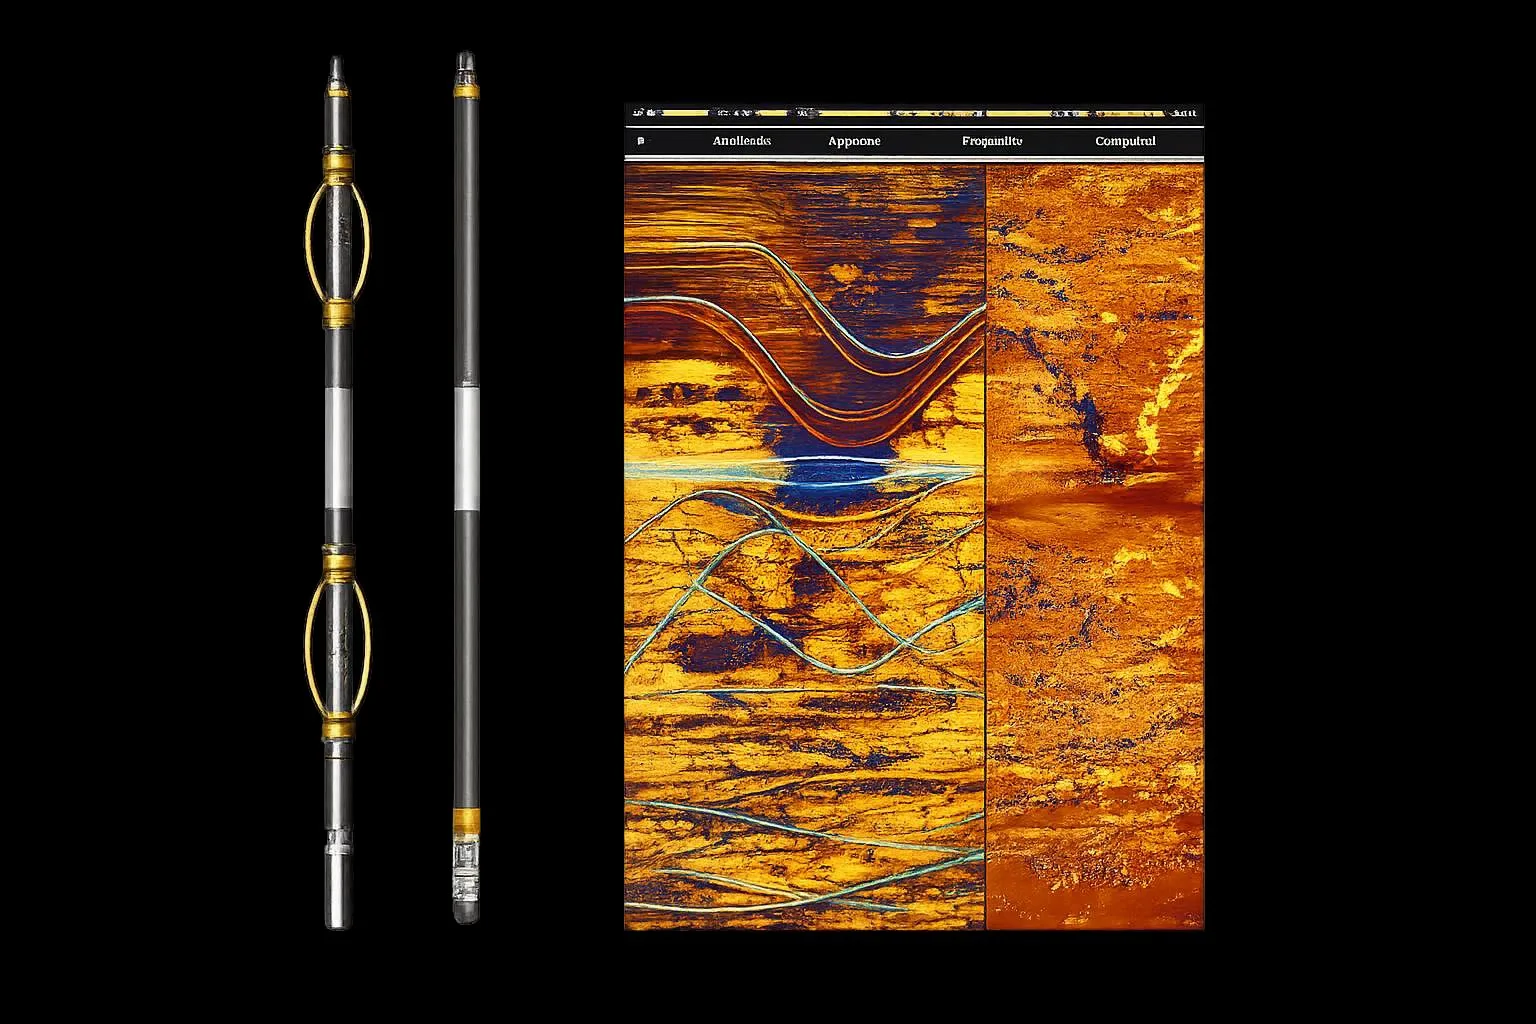
Oriented 360° borehole images to identify fractures and contacts at depth and give geometry to the slope's structural model.
Optical and acoustic televiewer probes
Optical and acoustic televiewer
OTV · ATV
The televiewer characterizes the rock mass beyond the slope face.
1,800 pxOptical · per circumference, 1 mm axial
288 pxAcoustic · 2 mm, with caliper
3 + 3Magnetometer and accelerometers
Optical image
True color in air or clear water.
Acoustic image
Amplitude and travel time in water or mud, with acoustic caliper.
Orientation and conditions
3-axis magnetometer and 3 accelerometers. Uncased borehole and centralized probes.
Resolution depends on configuration. Characterizes the rock mass; complements continuous monitoring.
From the 360° log to the structural model
Reports
Three deliverables for slope analysis.
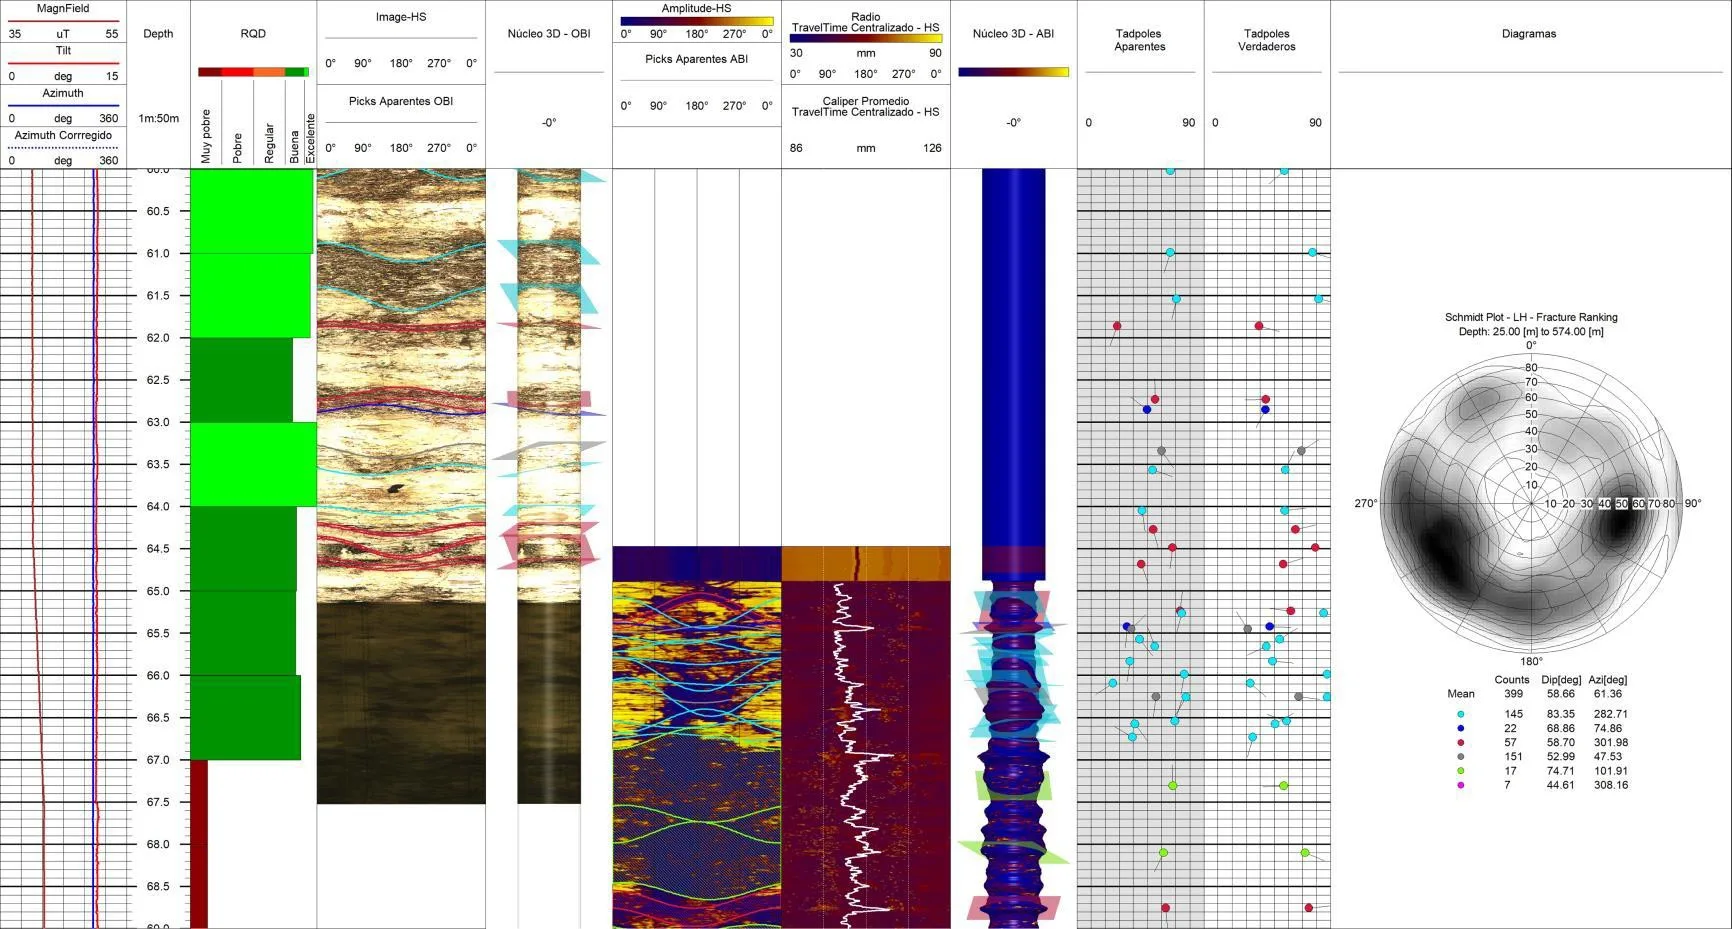
Example Proinfra report
Orient the fracturesDip direction, dip and depth: identify discontinuity sets for slope analysis.
Characterize the rockDigital RQD, caliper and virtual core: document fracturing and changes along the borehole.
Support the modelStereonets and rose diagrams to compare with core and mapping, and evaluate slope failure mechanisms.
02
Geotechnical instrumentation
Instrument the slope at depth
Pore pressure, internal deformation and localized movement, combined with surface observations to evaluate the deformation mechanism.
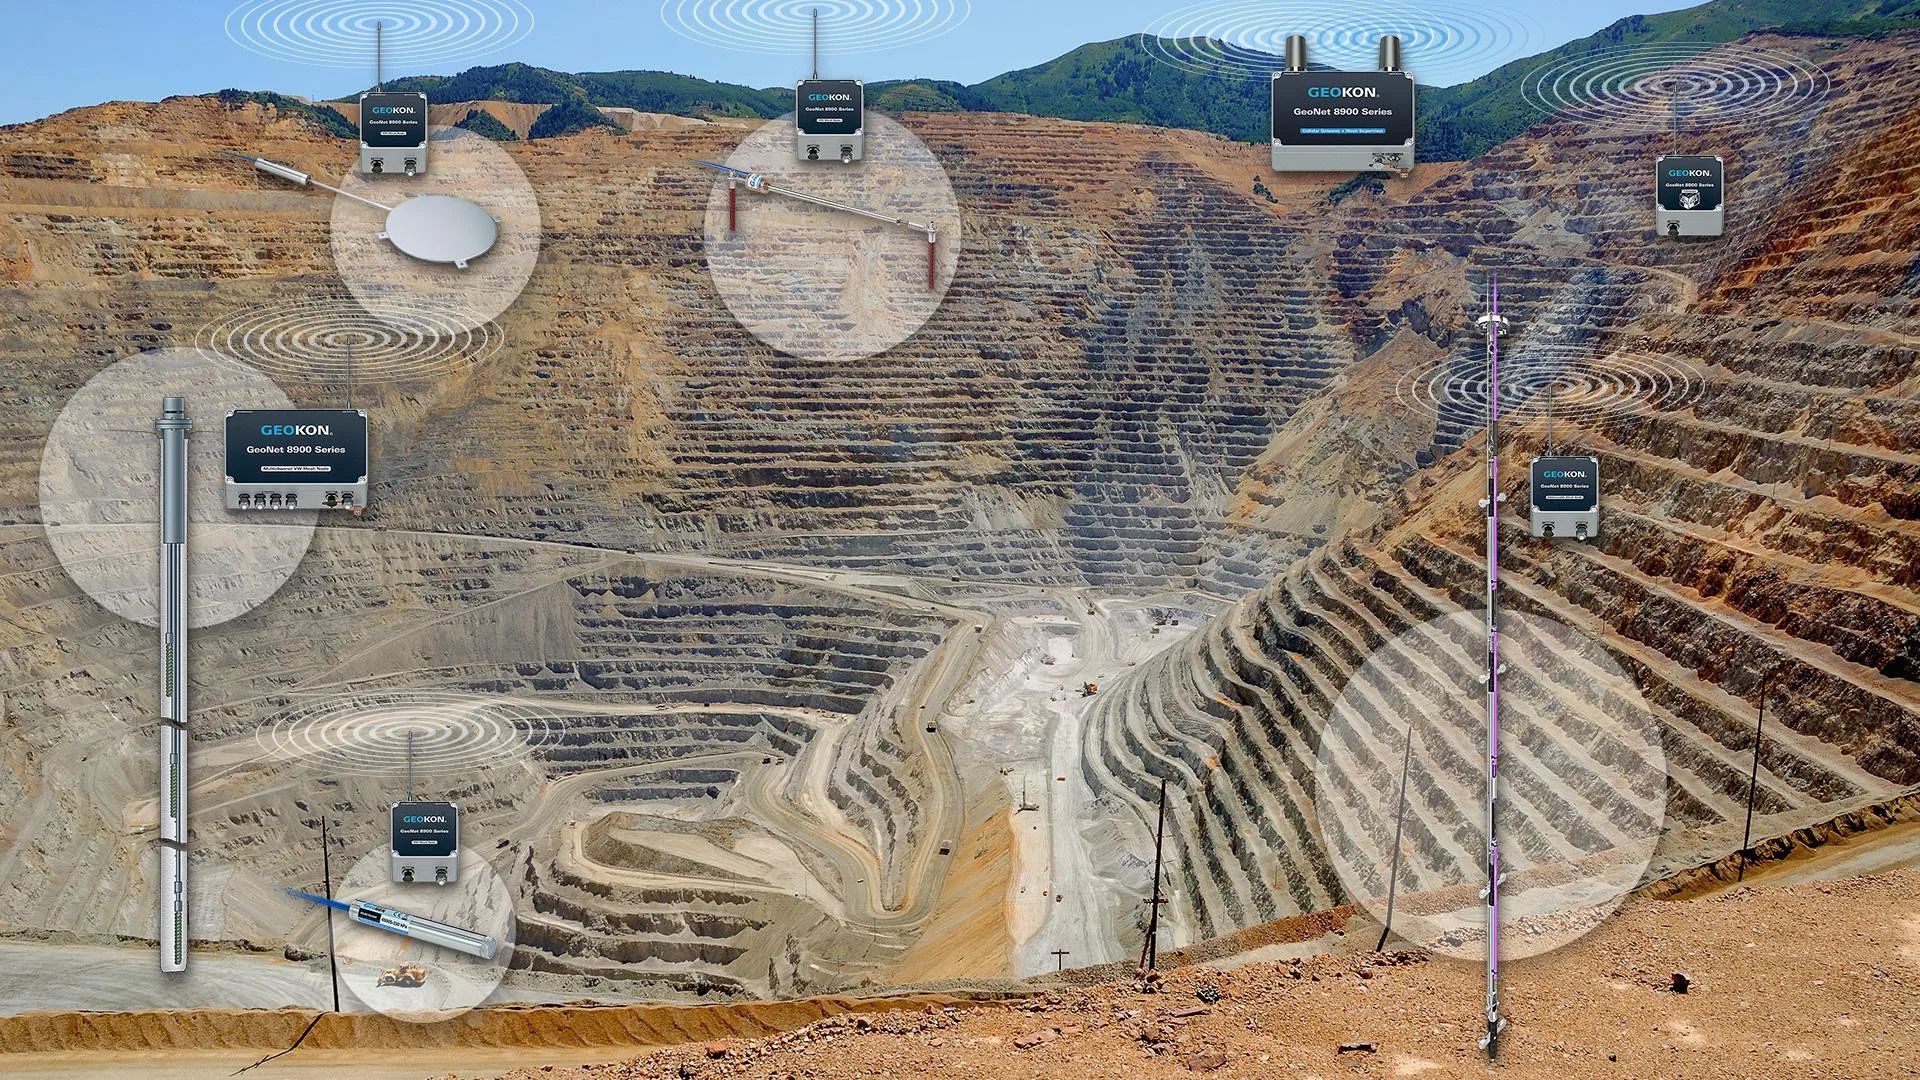
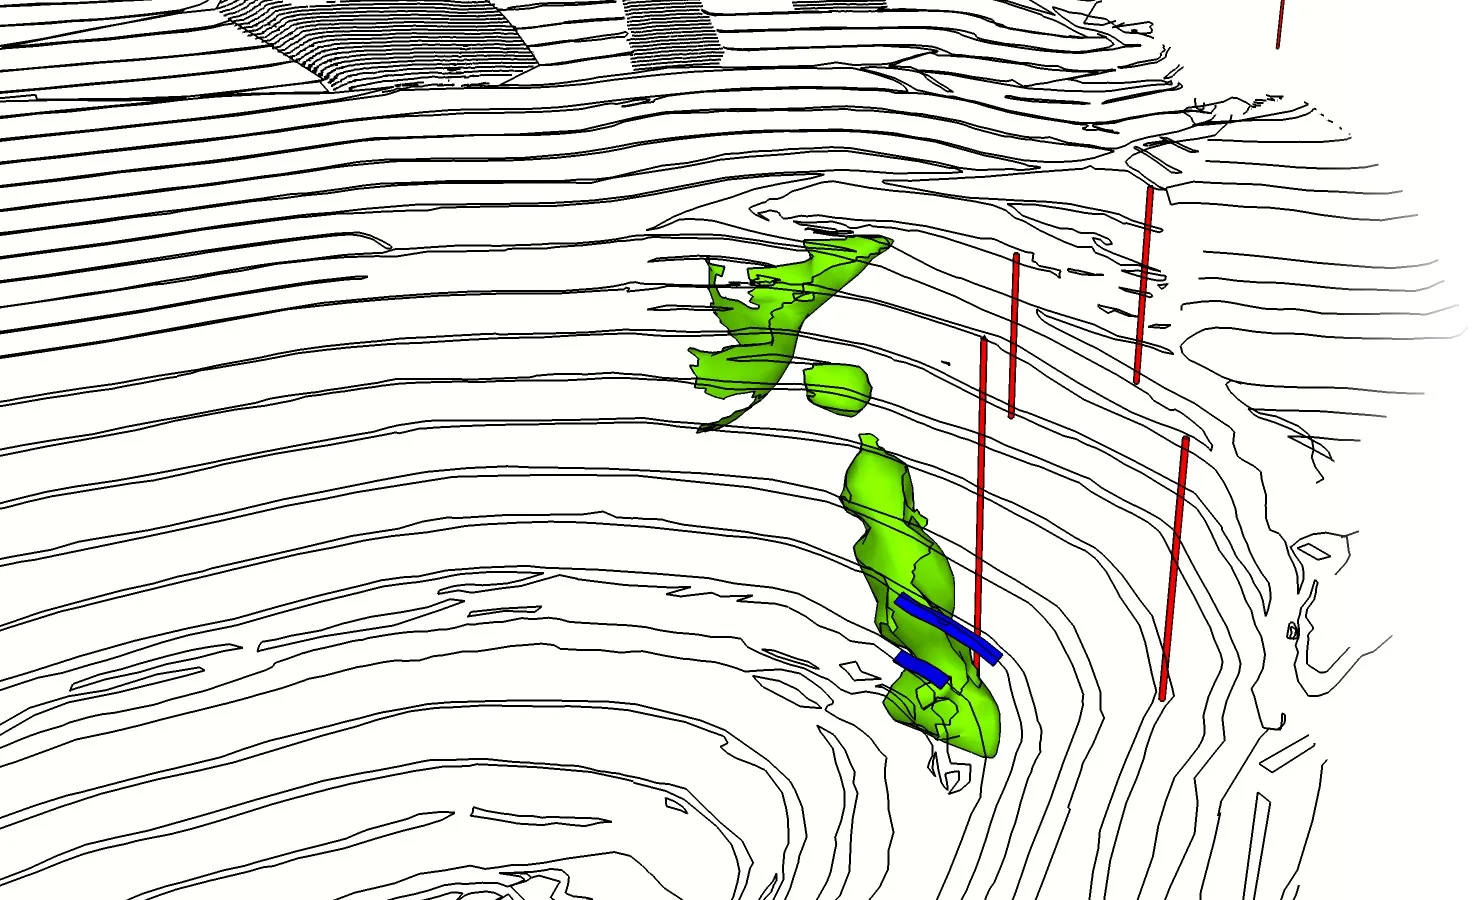
Instrumented pit · conceptual diagram
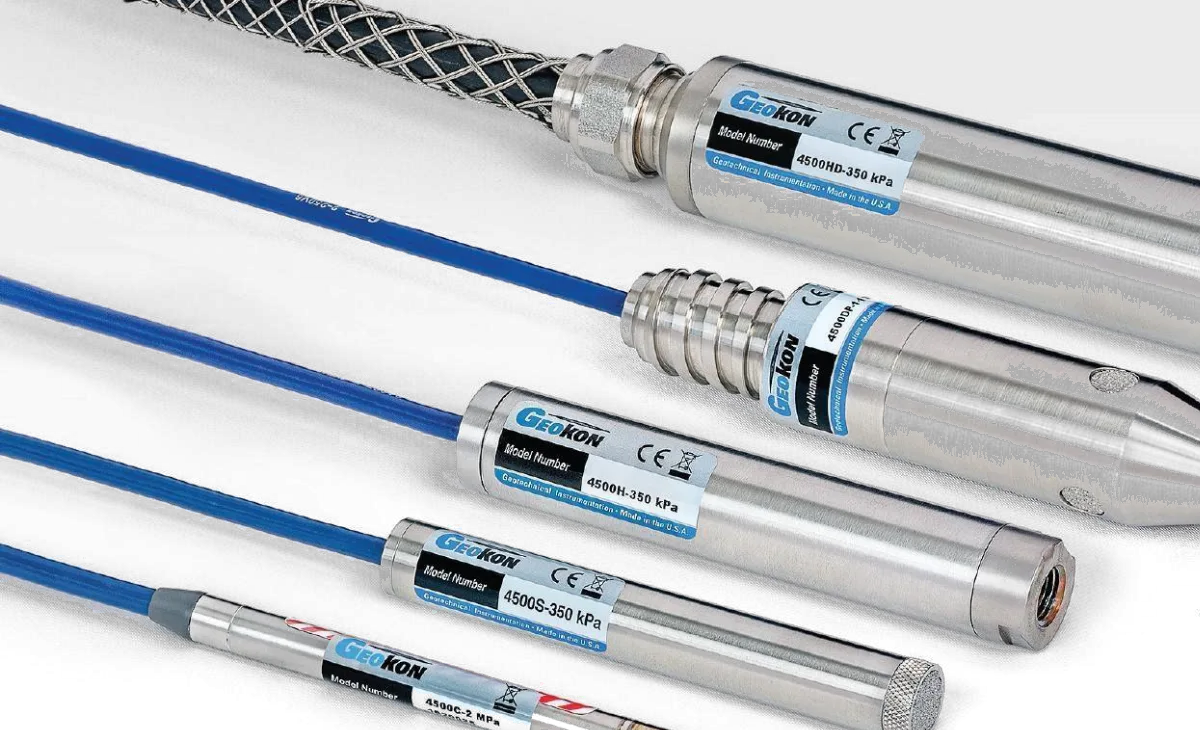
Vibrating wire piezometers
Pore pressure
Pore pressure and response to slope depressurization.
Vibrating wire piezometers
Principle
Pressure deflects a diaphragm and changes the wire tension. Its frequency is converted to pressure using the individual calibration.
Installation
Sensors at different depths in boreholes. The design considers structures, hydrogeological units and zones of interest.
Engineering reading
Pressure u in kPa and head h = z + u/γw. Compare with pumping, horizontal drains, rainfall and pit advance.
Defined hydraulic interval
Elevation, depth, saturation and seals identify which zone each sensor represents.
Verification and protection
Zero reading, calibration and cable protection. Check the response after installation and keep a traceable record.
A multilevel network allows units to be compared and shows whether depressurization reaches the target zones.
MEMS inclinometry
Shear zones
Deformation at depth and location of shear zones.
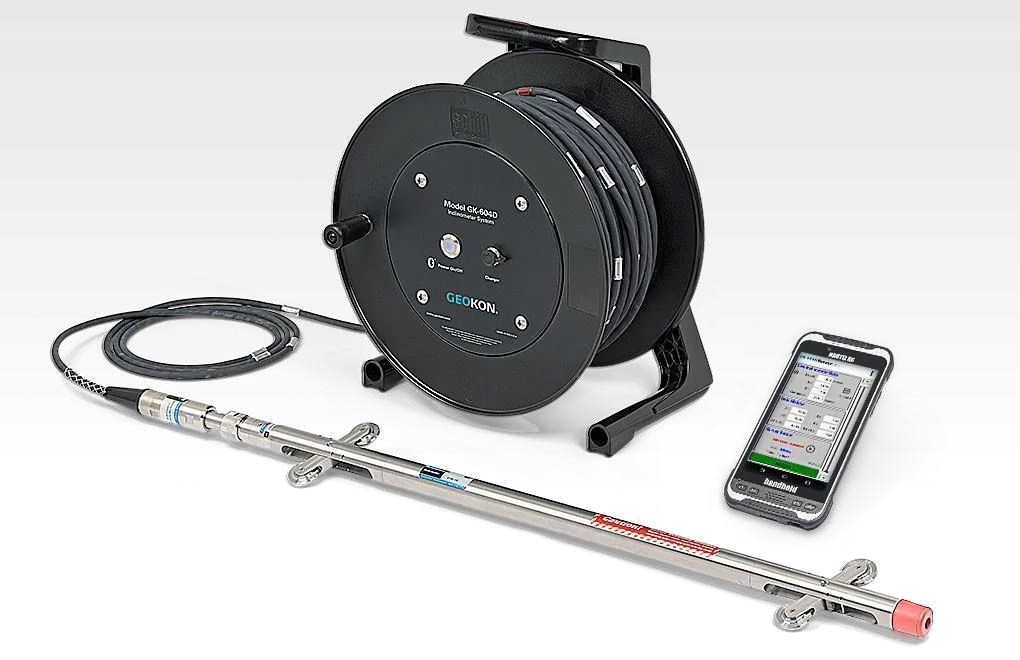
Portable inclinometer probe
Portable probe
Biaxial readings every 0.5 m in grooved casing. The profile accumulates Δ = L·sin θ and is compared against a baseline.
Permanent chain
MEMS sensors in a chain. Automates the evolution of the profile and allows the deformation rate at depth to be tracked.
Relating the profile to geology, benches and surface movement helps define the slope mechanism.
Extensometry and crack meters
Localized movement
Cracks in rock and deformation of fills and waste dumps.
Soil extensometer
Measures the change in length between anchors in fill material. Used in waste dumps or embankments with a specific design.
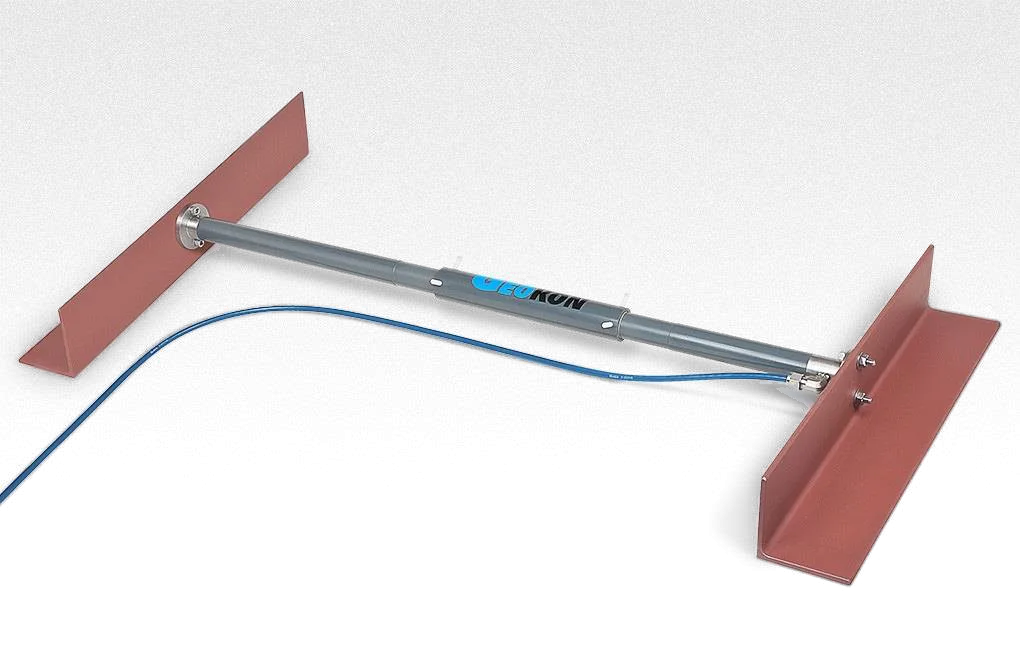
Crack meter
Anchors on both sides of a fissure in rock or concrete. Records opening or closing along the sensor axis.
Soil extensometer
Separating localized crack opening from fill deformation avoids interpreting both as the same phenomenon.
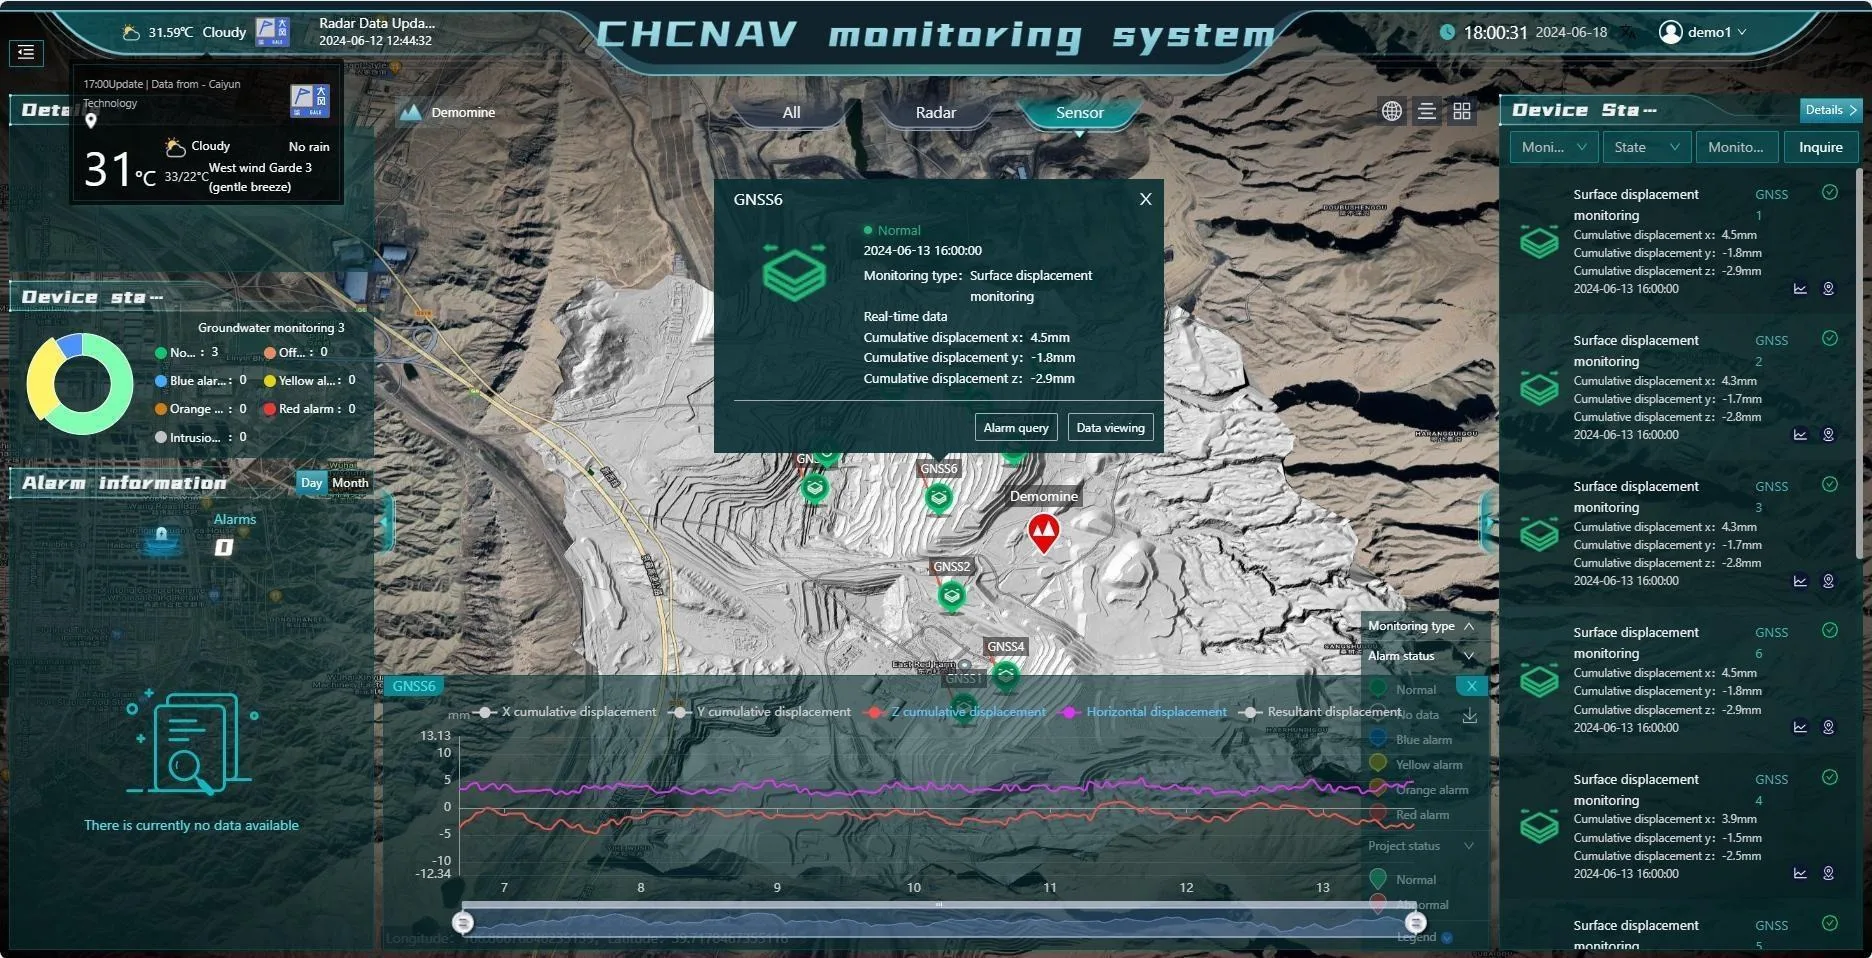
Automated readings in pit sectors
Wireless data loggers
Automating readings reduces gaps between campaigns.
Acquisition
Vibrating wire, thermistors, analog signals and Modbus RS-485 sensors, depending on the data logger.
Communications
LoRa radio, gateways and other links depending on the architecture. Review coverage as benches and access roads change.
Integration
Identified data, calibration and system status. Remote access and integration through compatible interfaces.
03
Geodesy · Radar · Satellite
Track slope movement
Movement vectors at points, sector coverage with radar, prisms with total stations and historical satellite context.
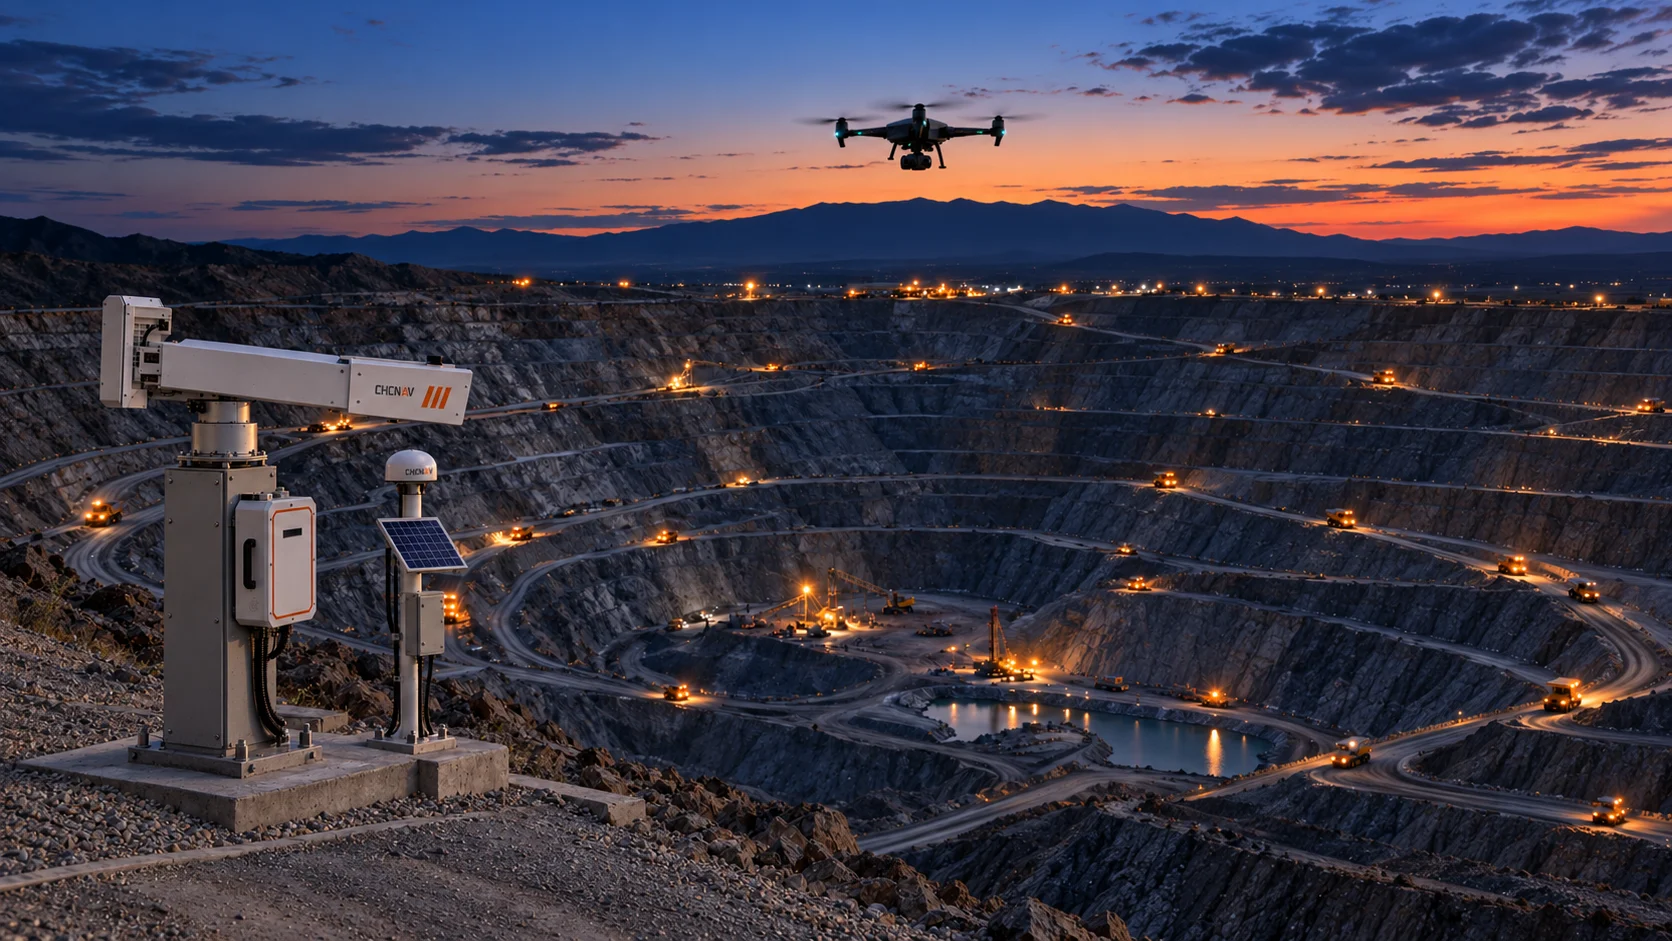
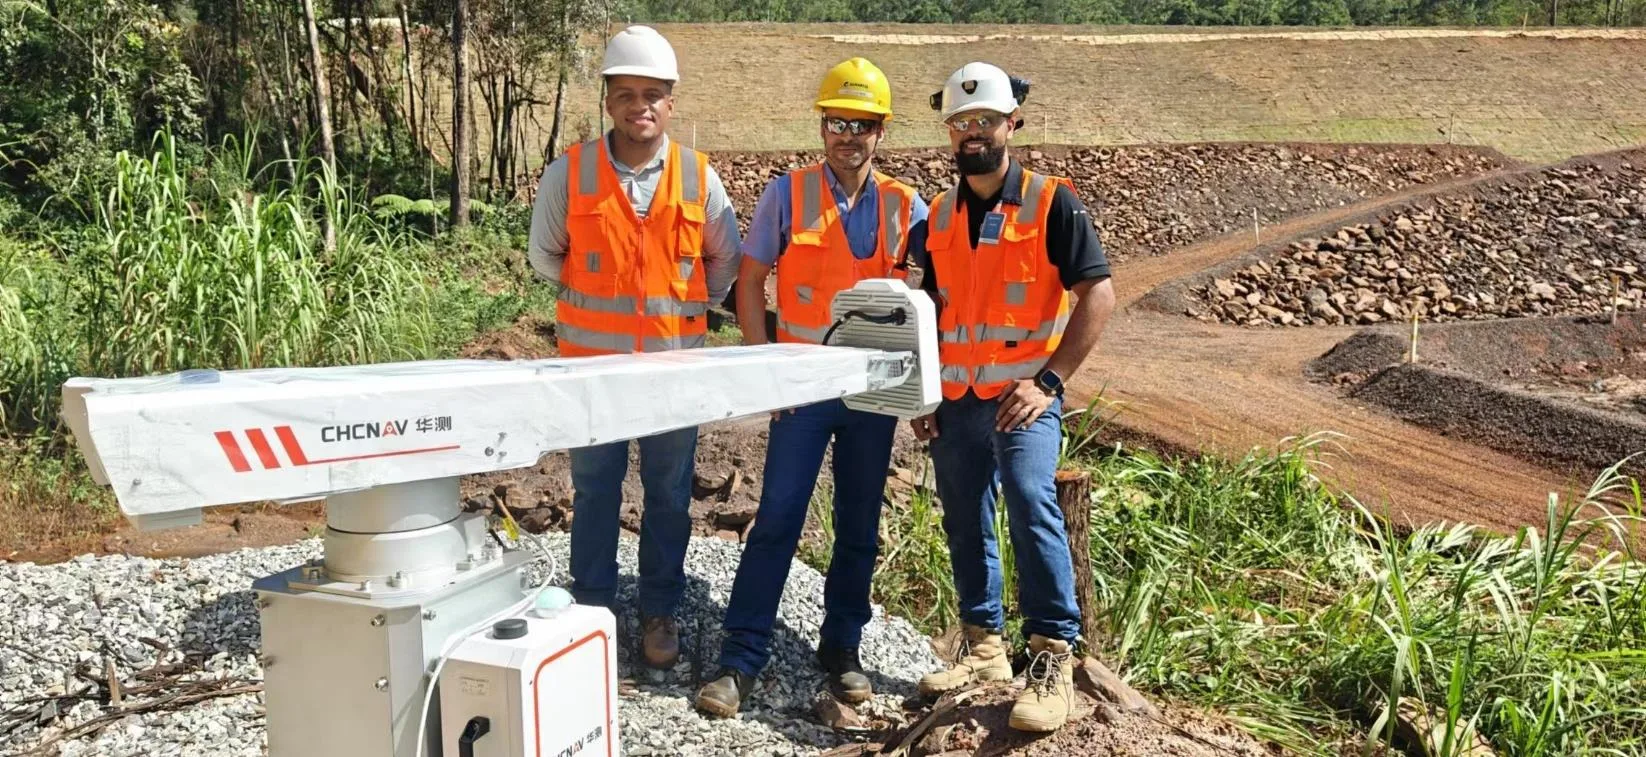
Ground-based radar in the field
GNSS + MEMS
Critical points
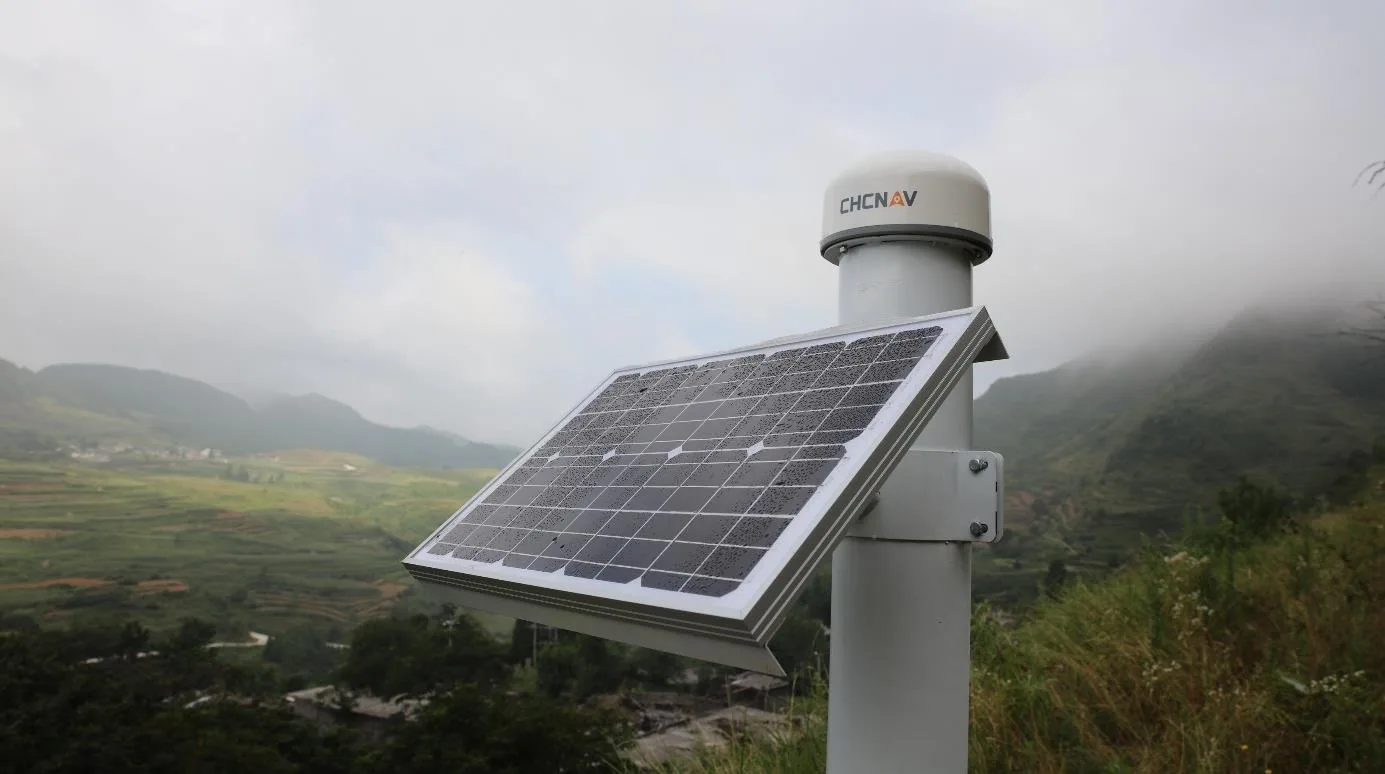
GNSS displacement at critical points on the slope.
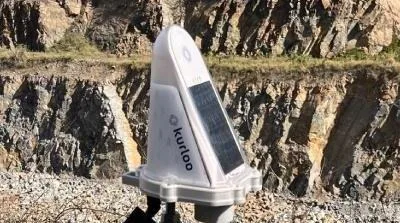
GNSS receiver with solar kit
Measurement
Estimates coordinates and displacements ΔX, ΔY, ΔZ. MEMS adds tilt and acceleration depending on configuration.
Processing modes
Post-processing for slow changes and RTK for higher frequency. Precision and latency depend on the mode and the site.
Installation
Points fixed to the ground, a stable reference, clear sky view and a link. Check for obstructions in deep benches.
Tracking the movement vector complements the line-of-sight component observed by radar.
GB-SAR ground-based radar
Large sectors
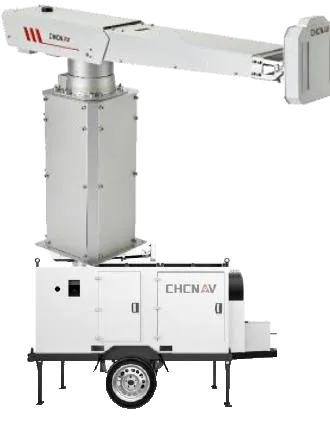
Ground-based radar to observe large sectors of the slope.
Trailer-mounted ground-based radar
Displacement
Maps, velocity and trends for each visible sector of the slope.
Alerts
Thresholds and persistence linked to the mechanism and the response plan.
0.1 mmManufacturer accuracy
Up to 5 kmCatalog range
120 s360° sweep
< 50 WCatalog power consumption
Line-of-sight measurement. Geometry, shadows and atmosphere determine useful coverage.
Radar with camera
Selected sectors
Radar and camera to review movement in selected sectors.
Compact radar with camera
Radar
Deformation at selected points with signal quality control.
Alert
Frequency and thresholds configured for the evolution of movement.
Camera
Supporting image to evaluate the context of the alert.
Up to 800 mCatalog range
15 WPower consumption
MultipointMultiple targets
The image complements the technical evaluation. Visual coverage depends on light, dust and visibility.
Relative GNSS network
Slopes and waste dumps
Densify point tracking with stable references.
Measurement node
GNSS receiver and IMU. Observations sent by radio to calculate position relative to one or more reference nodes.
Link and processing
The gateway sends observations to the server. Users view vectors, tilt, temperature and network status.
GNSS network node
Autonomous GNSS
Operation and closure
Movement tracking during operation and closure.
Autonomous GNSS unit
Measurement
Observations processed against references to obtain displacement time series.
Deployment
Integrated power and communications. Mounted on slopes, waste dumps or infrastructure with a clear sky view.
Interpretation
Review uncertainty, persistence and consistency between points before escalating an alert.
Automated total stations
Prisms
Prism displacement with an independent method.
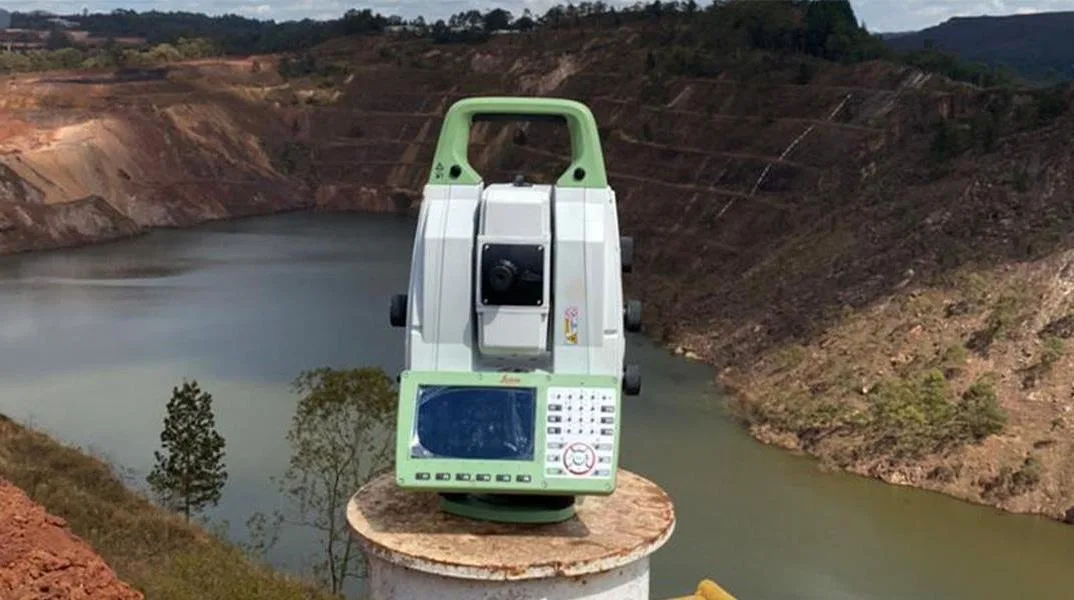
Total station on a pillar
Principle
Angles and electronic distance measurement determine the prism coordinates; repeated series deliver displacement.
Network design
Stable station and references. Prisms in sectors of interest, with redundancy and defined cycles.
Quality
Dust, refraction and obstructions affect readings. Control atmosphere, aiming and stability.
Satellite InSAR
Historical context
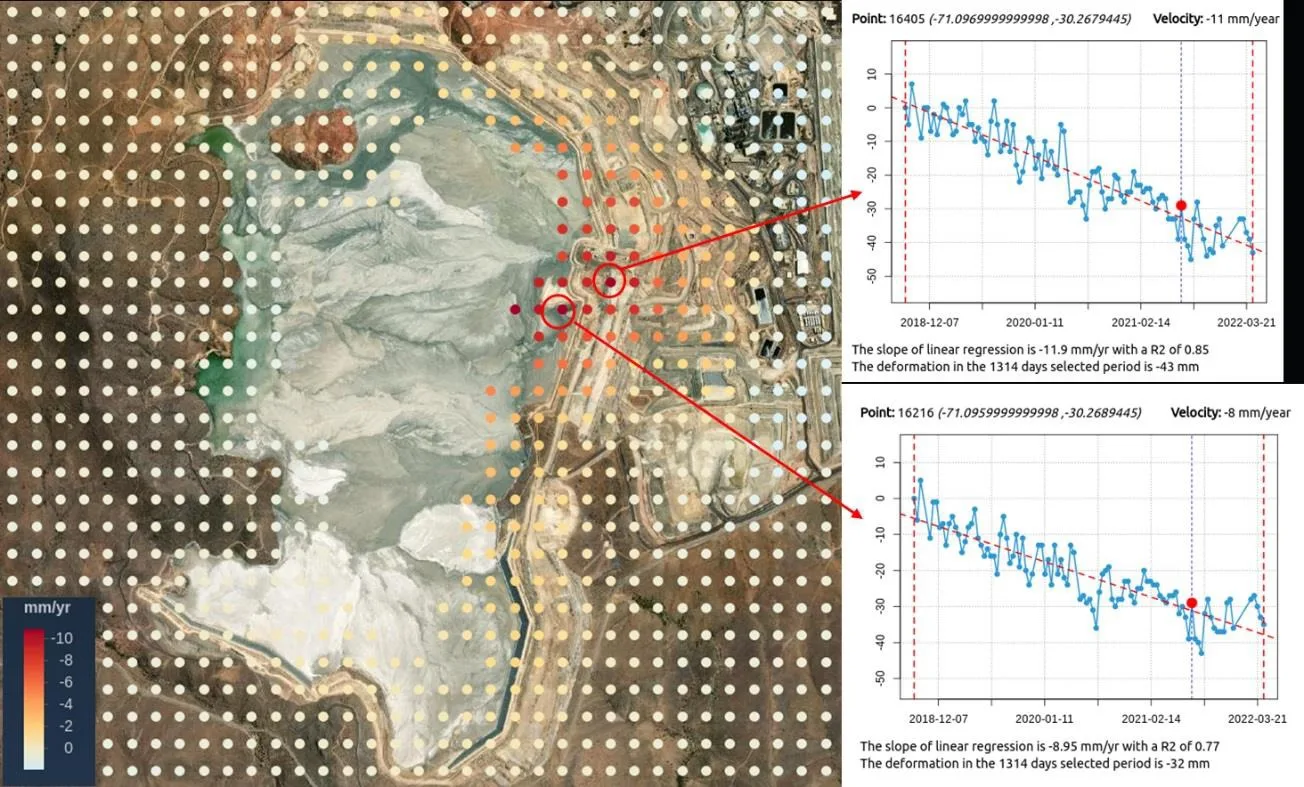
Satellite deformation of the pit and its surroundings.
Velocity map and time series
Principle
Phase differences between SAR acquisitions estimate displacement along the satellite line of sight.
Processing
Time series and velocity at coherent points, with atmospheric, topographic and orbital corrections.
Application
Trends on slopes, waste dumps and infrastructure. Excavation can reduce coherence.
Provides historical and spatial context. Updates depend on the satellite and do not constitute continuous observation.
04
Geophysics · Hydrogeology
Find where water enters
Preferential water paths into the pit, solution losses from heap leach pads and subsurface discontinuities around the pit.
Electrode layout in a pit
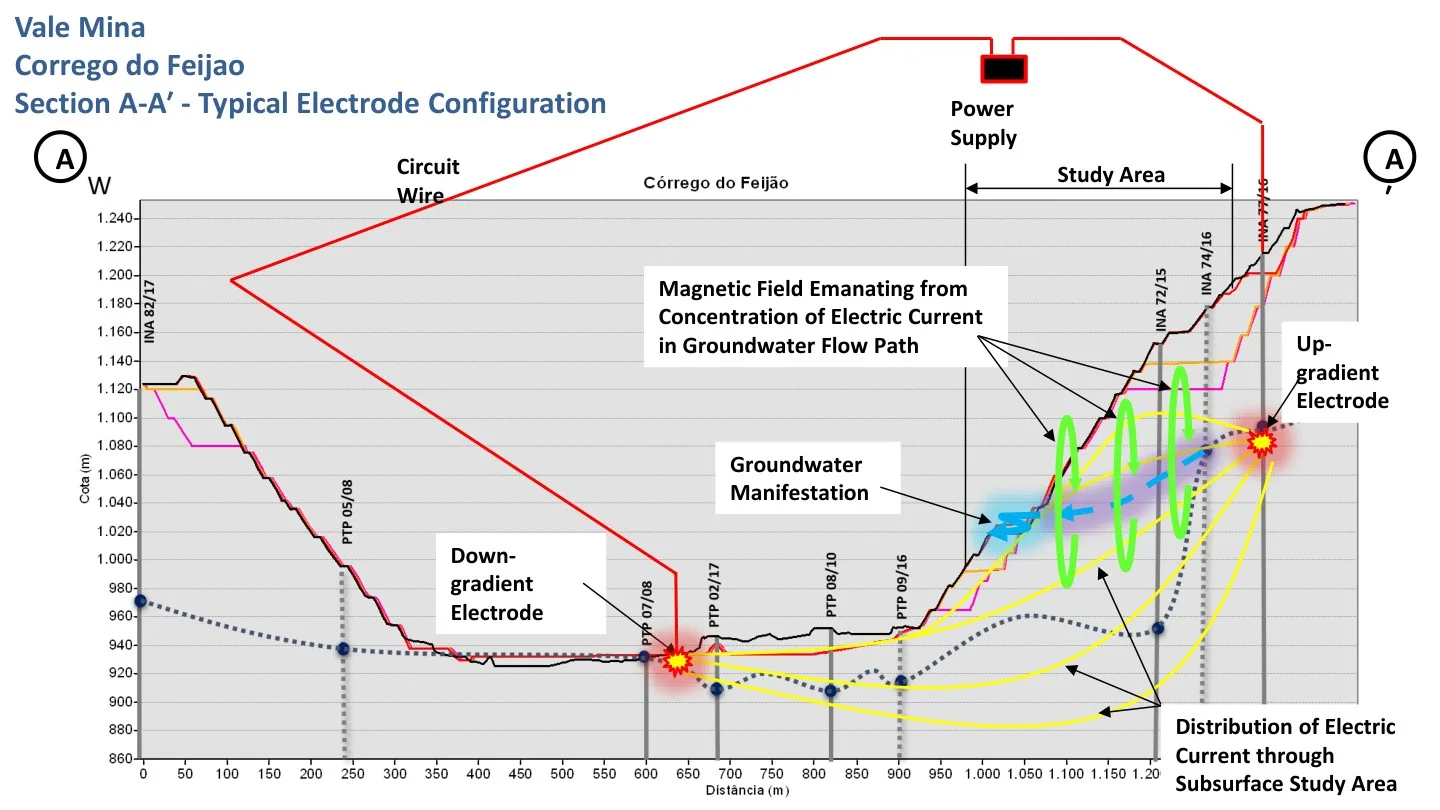
Groundwater flow mapping
Controlled current
Preferential paths of water entering the pit.
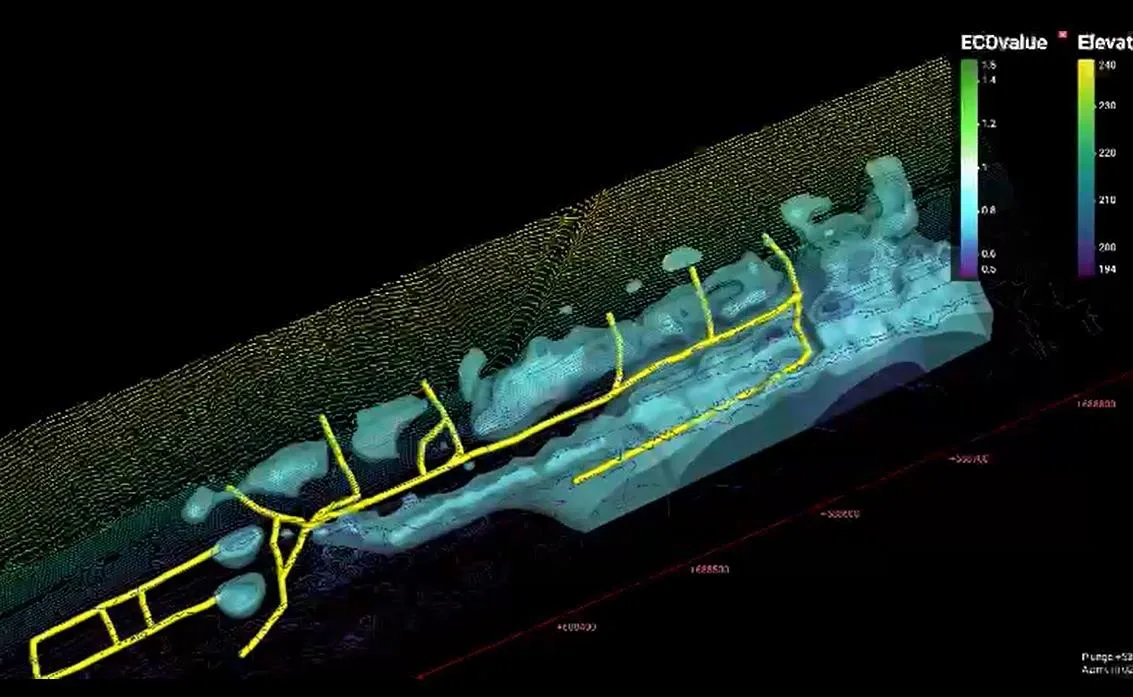
Pit connectivity model
Controlled source
Electrodes inject alternating current. Water and conductive materials govern its distribution.
Magnetometric measurement
The magnetic field and its position are recorded; modeling reconstructs the current distribution.
Interpretation
Conductive connections are compared with geology, piezometers, boreholes and discharges.
The electrical response does not measure flow directly. Reach and depth depend on electrode geometry and site conductivity.
Heap leach pads
Solution losses
Locate potential seepage paths in the leach pad.
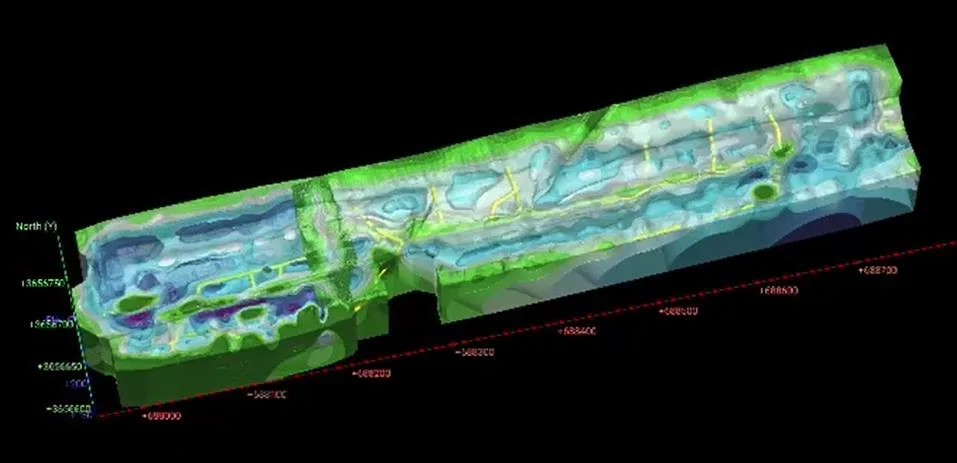
3D view of the investigated volume
PrioritizeCross-reference conductive connections with the geometry of the pad, its berms and drainage.
ConfirmCompare with the solution balance, piezometry, underdrains and liner integrity tests.
ActWith confirmed evidence, guide repair, drainage or interception.
3D model with scale and elevation
Microseismic resonance · MSR
Passive method
Passive investigation of the subsurface around the pit.
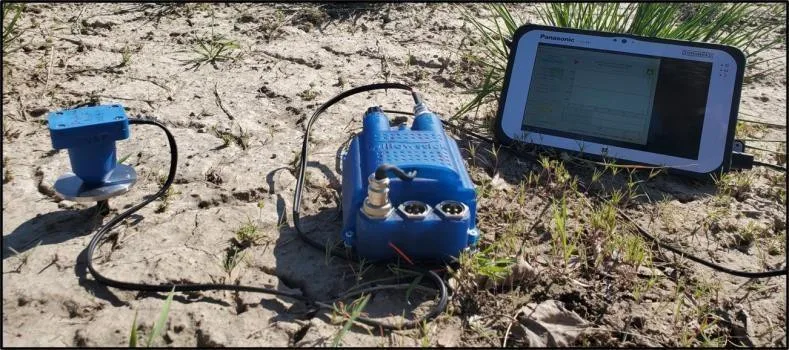
MSR survey in the field
Ambient vibration acquisition
Sensors record ambient ground motion at georeferenced stations.
Response and interpretation
Spatial contrasts to interpret structures and zones of interest. Anomalies require geological correlation and boreholes.
Guides the investigation of discontinuities and possible karst features. On its own it does not determine slope stability.
05
Acquisition · Platform · Response
From data to action by sector
Programmable data loggers, seismographs for blasting and earthquakes, a platform that correlates radar, GNSS and sensors, and a response plan with assigned responsibilities.
Visualization and alarm platform
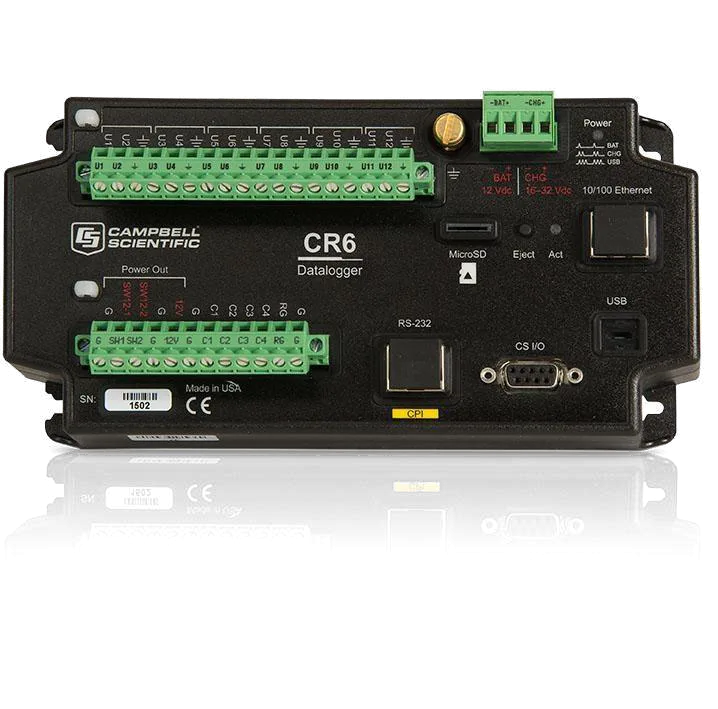
Programmable data logger
Signal diagnostics
Programmable acquisition and signal diagnostics.
Programmable data logger
Multi-sensor measurement
Acquires and processes geotechnical and environmental signals through compatible channels, modules and protocols.
Vibrating wire with spectral analysis
Identifies frequency and quality parameters to diagnose signal and noise.
Logic in the field
Local reading, storage and diagnostics; power and links adapted as the mine evolves.
Seismographs and vibration monitoring
Triaxial seismograph
Vibration from blasting and earthquakes to evaluate the response of slopes and infrastructure.
24-bitAcquisition resolution
50–2,000Samples per second
IP65Aluminum enclosure, 1.5 kg
Blasting
Triaxial velocity: peaks and frequency to characterize vibration at slopes, structures and receptors.
Earthquakes
Acceleration: record the event and compare the response between sectors of the pit.
Joint interpretation
Correlate with radar, GNSS, piezometry and post-event inspection.
Event and background
Pre-event of 1 to 30 s and post-event of 1 to 100 s; peak recording by interval.
Network and notifications
GPS/NTP synchronization; Ethernet, Wi-Fi or 4G; email and SMS notifications with remote access.
Sensor according to the objective
Velocity with a triaxial geophone; acceleration with MEMS or force-balance sensors.
Thresholds defined for the pit and its receptors, with a response approved by operations.
Multi-source platform
Radar · GNSS · sensors
Correlation of radar, GNSS and sensors in one platform.
Acquisition
Validate interfaces, units, timing and status of each source.
Analysis
Maps, 3D models, displacement and velocity curves, historical data and export.
Notifications
Thresholds by sector, magnitude, velocity and persistence; log of alerts and responsibilities.
Data management and response
Trigger action response plan (TARP)
Alarms with assigned responsibilities and actions by sector.
ValidateCheck quality, baseline, power and communications before interpreting a change.
InterpretRelate magnitude and velocity to piezometry, rainfall, blasting and pit advance.
RespondResponsibility, access restriction, escalation and re-entry criteria.
The geotechnical team defines and approves thresholds. An alarm requires an operational response protocol.
06
Environment · Haul roads
Control dust and haul roads
Weather, particulates and air quality to verify controls, dust suppression with field metrics and continuous haul road monitoring.
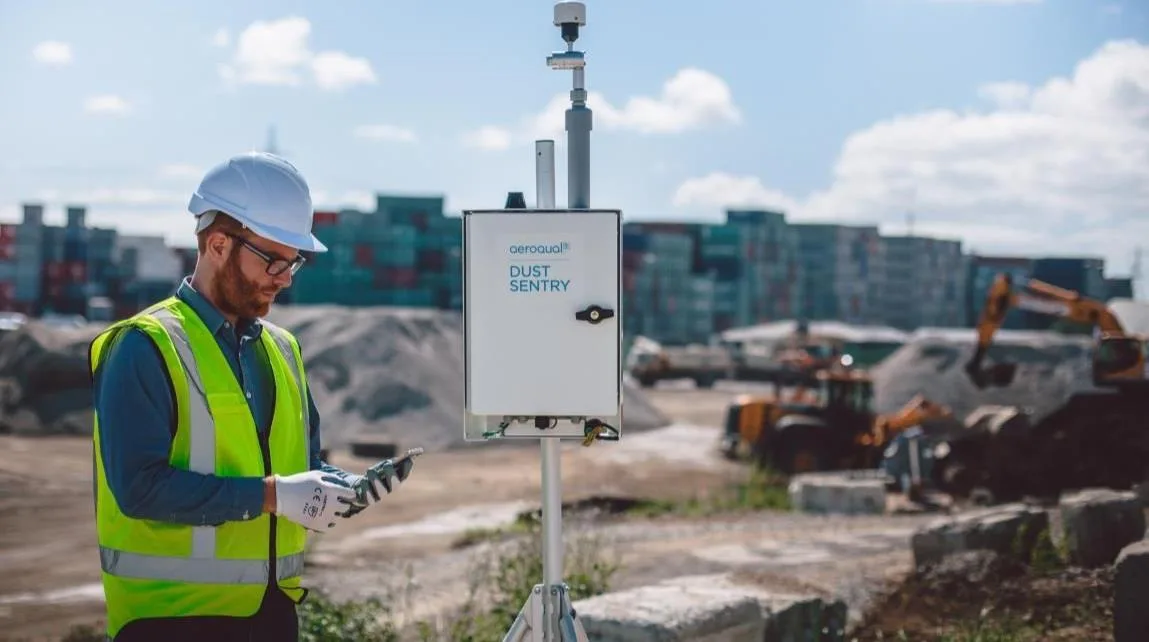
Perimeter dust monitoring
Weather
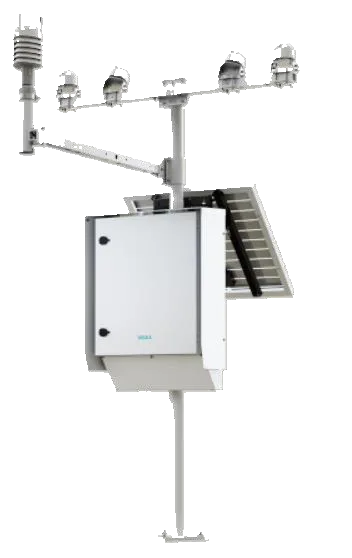
Rain and wind
Rain and wind to put pit operations in context.
Weather station
Precipitation and water balance
Cumulative rainfall and intensity to evaluate runoff and piezometric response.
Wind and evaporative potential
Wind, temperature and humidity to put dust and evaporation windows in context.
Dust monitoring
Haul roads, faces and perimeter
Particulates on haul roads, faces and the perimeter.
Optical measurement
Relates the optical response to mass concentration; PM fractions depending on configuration.
Observation network
Stations according to sources, receptors and wind; correlate with hauling, crushing and blasting.
Quality control
Flow, zero, cleaning and checks. Dust and humidity affect comparability.
Air quality stations
Particulates and gases
Air quality and tracking of control actions.
Configurable station
Particulates and gases according to sources and objective, with defined modules, range and maintenance.
Remote traceability
Time series, status and alerts in the cloud; record of calibrations, service and availability.
Evaluation
Compare equivalent periods before and after an intervention, with a control area or period.
Modular air quality station
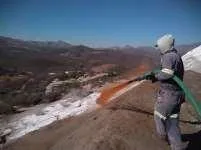
Dust suppression
Trial and scale-up
Dust control on exposed surfaces and haul roads.
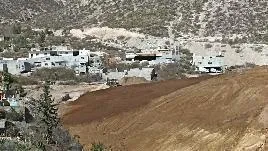
Suppressant applicationTreated surface
Mechanism
Natural polymers bind particles and form a surface layer.
Application at the mine
Waste dumps, slopes and haul roads require different doses and preparation.
Economic criteria
Water use, reapplication frequency and cost per area effectively protected.
Trial designTreated and control sections; document dose, water, preparation and traffic.
IndicatorsPM under comparable wind and activity, persistence, erosion and response to rainfall.
Scale upWith dose, frequency and cost proven on the operation's material and water.
Continuous road monitoring
Haul routes
Every trip reveals the condition of the road.
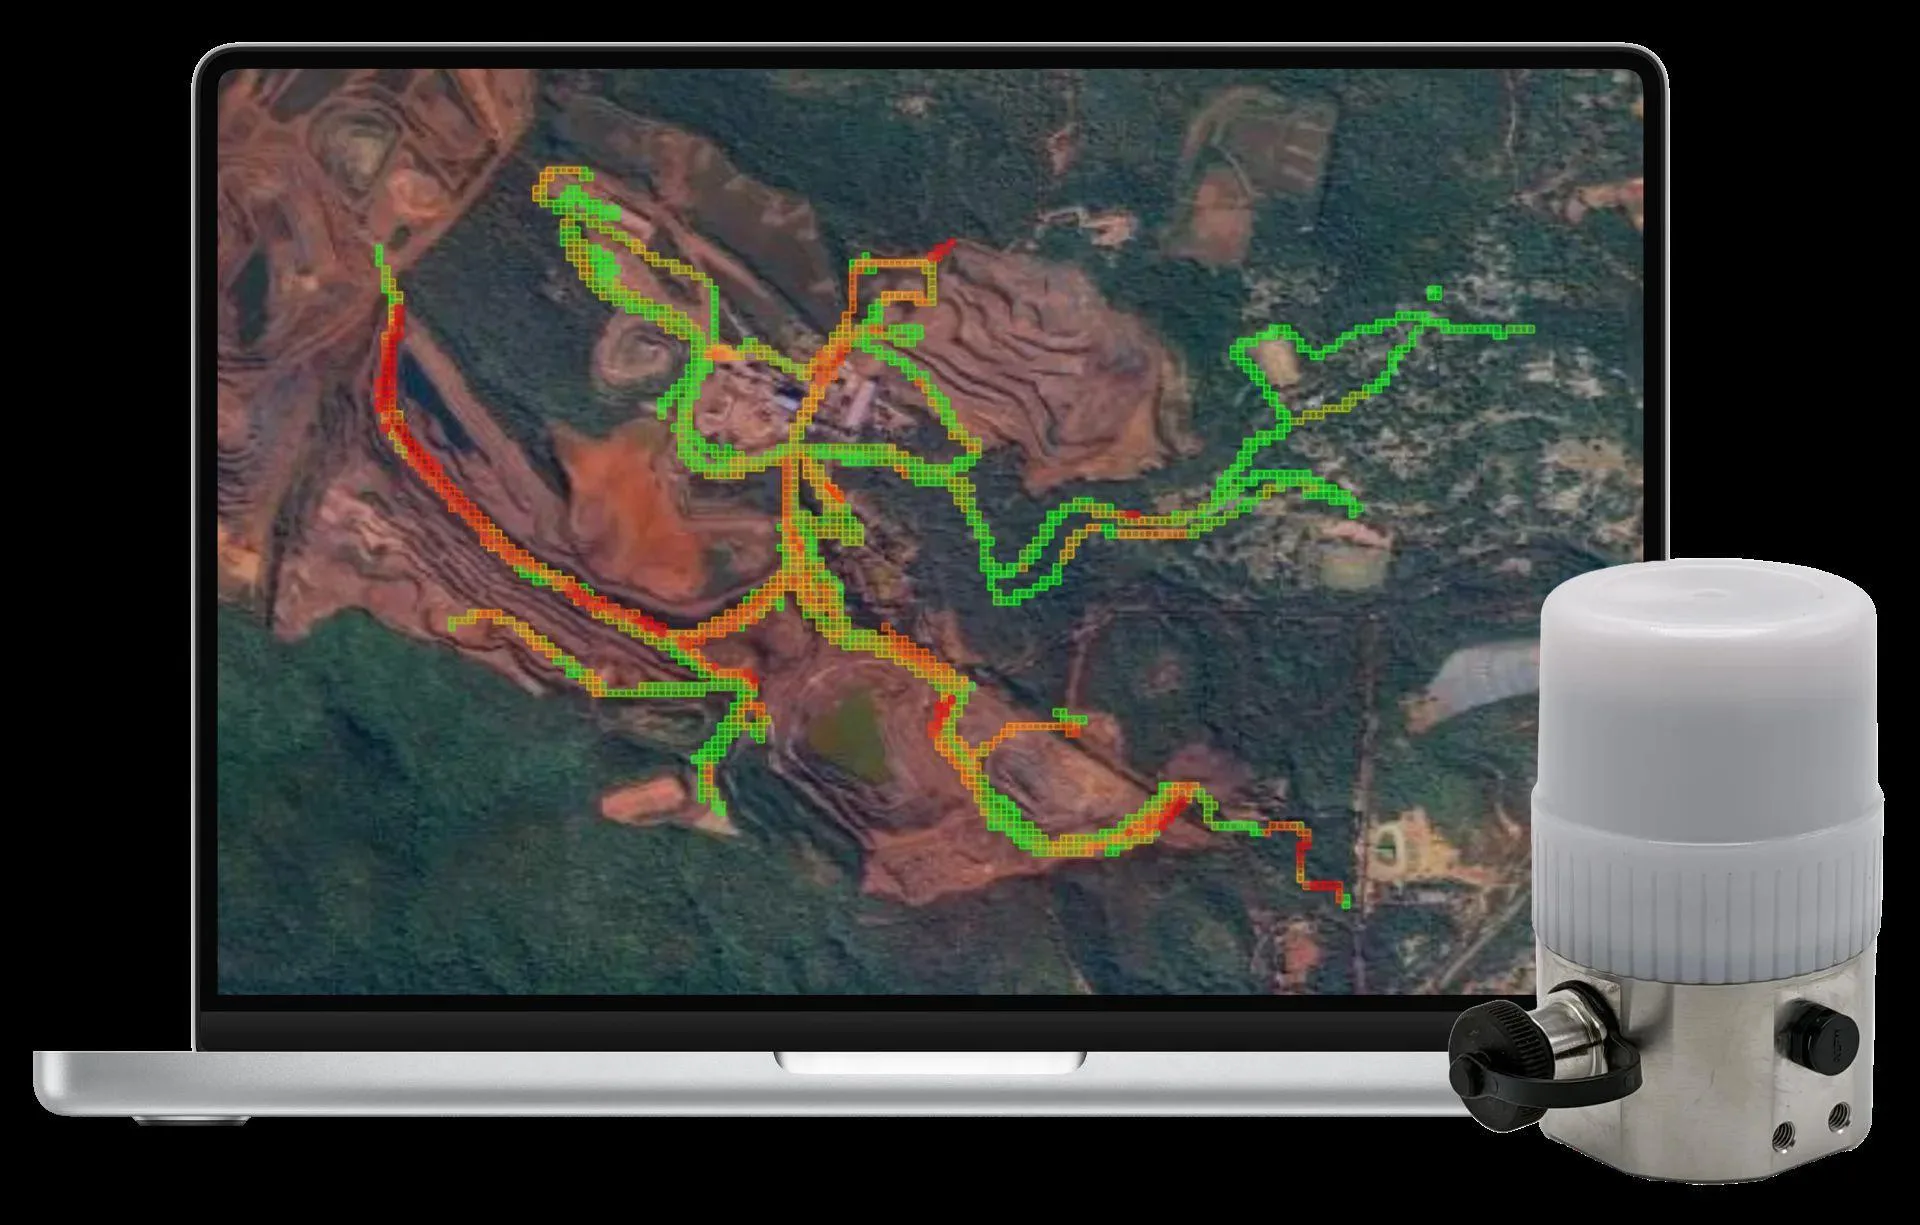
Road condition map
Georeferenced measurement
6-axis IMU + GPS. Records vibration and locates irregularities along haul routes.
Installation on the fleet
External mounting with DC power; operates without integrating into the fleet management system.
Field-ready device
9 × 5.7 cm · IP65 · −40 to +65 °C. 4G LTE / eSIM; BLE and Wi-Fi.
Baseline5 devices on 5 vehicles for 30 days on representative routes.
InterventionGrade or treat defined sections; document date, cost and conditions.
ValidationReview the change at 30–60 days and cross-reference with cycle times, fuel and maintenance.
Savings must be validated with mine data before scaling up.
07
Fiber optics · Mine water
Protect infrastructure and water
Leaks on mine water pipelines, temperature on conveyor belts and evaporation of excess water in authorized ponds.
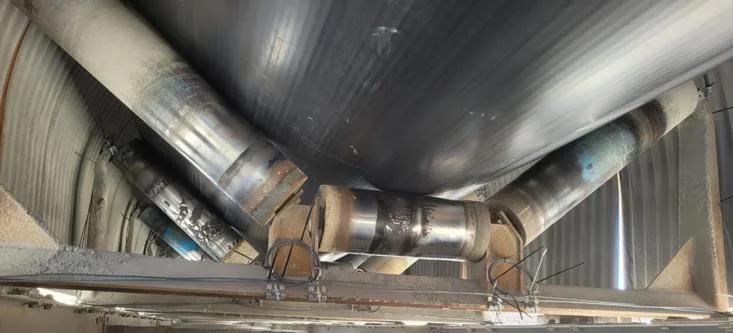
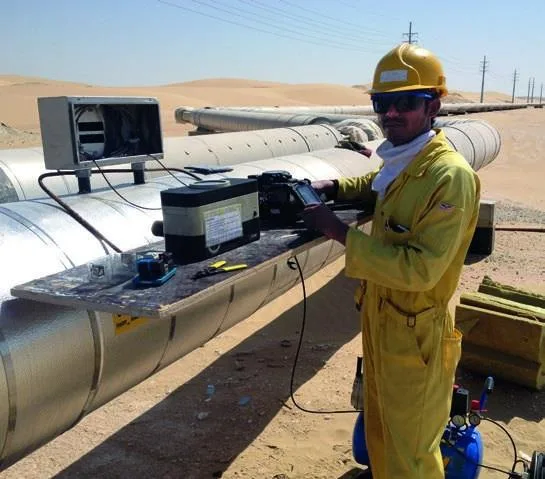
Thermal monitoring of idlers
DTS + DAS fiber optics on pipelines
Pipeline leaks
Locating leaks on mine water pipelines.
Fiber optics on a pipeline
DTS · thermal signature
Temperature changes around the pipe; the position of the fiber determines the response.
DAS · dynamic signature
Vibration associated with leaks, impacts or nearby excavation.
Locating an anomalous section helps direct inspection of dewatering, pumping and service lines.
Temperature on conveyors
DTS · linear heat detection
Conveyor temperature and infrastructure protection.
Measurement
The fiber measures temperature along the asset and locates hot spots.
Location
Belts and idlers, cable tunnels and power systems.
Response
Temperature alerts with location for inspection.
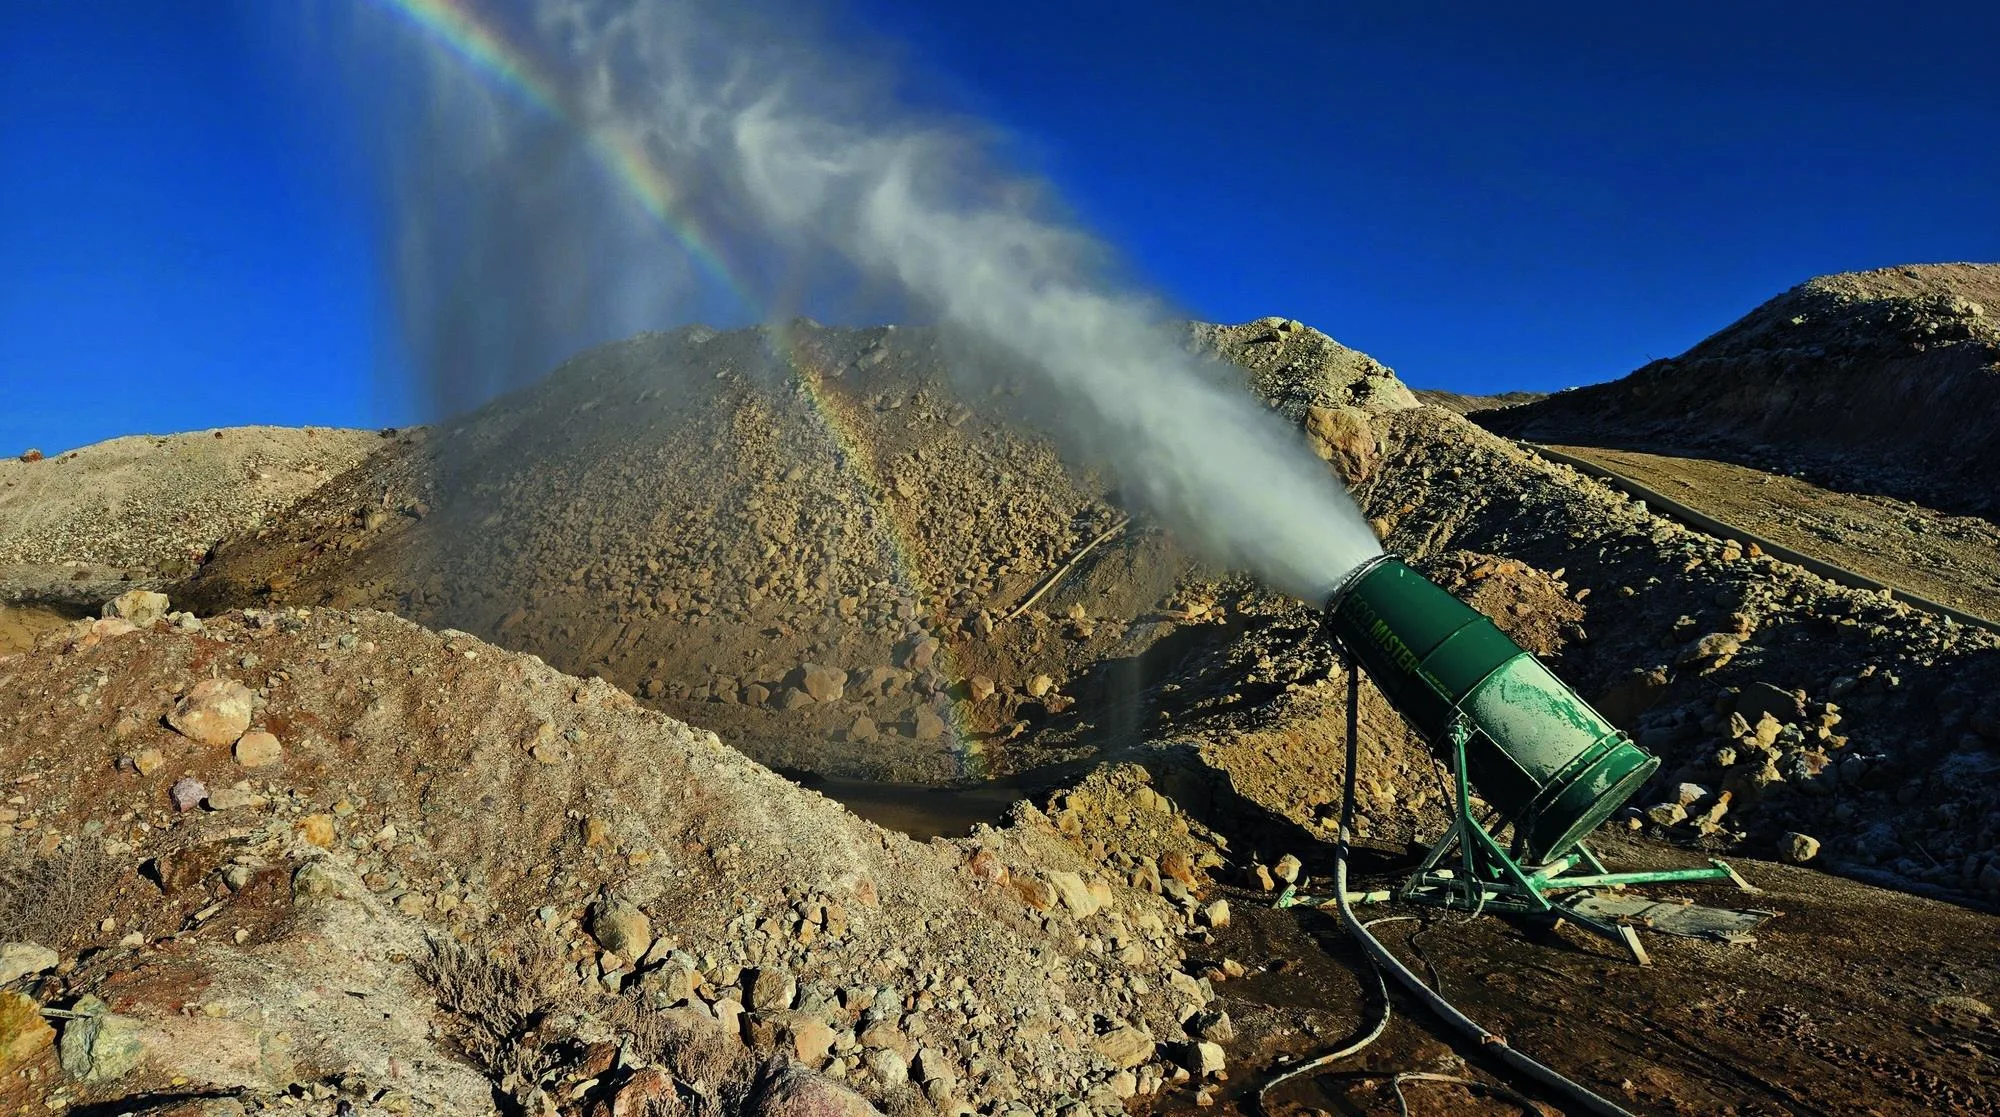
Evaporators for water disposal
Excess water in ponds
Enhanced evaporation in mine water ponds.
Evaporator in operation
Physical principle
Atomization increases the water–air surface area; it depends on droplet size, residence time and vapor deficit.
Capacity
Up to 160 m³/h of feed per unit; the evaporated fraction is estimated from site conditions.
Balance
Separate water fed, effective evaporation and return; integrate wind and the capture zone.
Feed flow is not equivalent to water evaporated. Size the system with actual weather, constraints and availability.
Implementation
Scope and acceptancecriteria.
Proinfra integrates technology, installation and support so the system meets a defined need.
DesignSector, mechanism and decision. Selection of instruments, coverage, frequency and communications.
AcceptanceCalibration, mounting, initial reading and a complete test of data and alerts with the mine's responsible staff.
Life cycleTraining, service and performance review. Adjustments as benches, access roads and closure progress.
Frequently asked questions
What we are asked most often.
What technologies are used to monitor slopes at open pit mines?
Slope radar, prisms with a robotic total station, GNSS, inclinometers, piezometers and seismographs, integrated in one platform.
What is the difference between radar and prisms?
Radar covers the entire slope continuously; prisms measure specific points with high precision. They are usually used together.
Do you monitor blast vibration?
Yes. Triaxial seismographs record the vibration of each blast to control its effect on slopes and infrastructure.
Do you also handle dust and air quality in the pit?
Yes. Particulate and gas monitoring, and dust suppression on haul roads.